For more analysis of Apple & the industry, join us at ACTIVE 2025.

Asymcar 2: Is Tesla Disruptive? Also Segway, Multiair, Winglet, Organ Donors & Regulation

Podcast 2: Is Tesla Disruptive? Also Segway, Multiair, Winglet, Organ Donors & Regulation Über Alles | Asymcar.

Horace Dediu and Jim Zellmer discuss the odds of disrupting the present automotive club via Tesla. We further dive into the regulatory and cultural environment that sustains the current players, while reflecting a bit on Segway, Toyota’s Winglet, organ donors and the Fiat “multiair” engine. Finally, we preview a larger discussion on apps in and around the car. [24MB 57 minute mp3]


That Competition Thing

Bill, I think the smartphone market has always been competitive. [Only] the names have been changed.

Tim Cook responding to Bill Shope’s question on the competitive landscape, April, 2013.

Indeed, over the years, the companies considered Apple’s primary competitor have been many.

In years gone by in the phone market there were RIM and Nokia and Palm and HTC. In the iPod era there was Creative and Sony and innumerable others long forgotten (not to mention the tyranny of DRM).

Even today we struggle to decide whether Apple competes with Google first or Samsung. Or perhaps with the iPad it’s with Amazon or  Microsoft. Or maybe iTunes is threatened by Netflix or Spotify. The Mac surely competes with HP and Dell and Toshiba. What about iCloud? Clearly it’s Dropbox or Google Drive. iWork? Both Office and Google Docs.

Doing a competitive analysis for Apple is then mostly a struggle of whom to compare it to. So forgive me that I only track the few challengers shown below.

Screen Shot 2013-08-13 at 8-13-2.14.59 PM

Continue reading “That Competition Thing”

Apple's biggest acquisition

At the end of the first quarter 2013 there were 946,035,000 fully diluted shares of Apple stock outstanding. At the end of the second quarter there were 924,265,000. The 21,770,000 shares that disappeared were purchased by Apple and retired. Apple shares traded between $390 and $463 during the quarter so it’s hard to know exactly how much Apple paid for them, but at an average of $426.5 per share Apple would have spent $9.3 billion

Management explains:

In late April we executed a very successful debt offering issuing 17 billion of debt across 3, 5, 10 and 30 year maturities. We paid $2.8 billion in dividends in the quarter and we also utilized a total of $16 billion in cash on share repurchase activity through a combination of a new accelerated share repurchase program and open market purchases. $12 billion of the $16 billion was utilized under a new ASR program initiated with two financial institutions in April.

An initial delivery of 23.5 million shares was made under this program with the final number of shares delivered in average price per share to be determined at the conclusion of the program, based on the volume weighted average purchase price of Apple’s stock over the program period, which will conclude in fiscal ‘14. In addition to the new ASR, we executed $4 billion of open market share repurchases, resulting in the retirement of 9 million additional shares.

Later, during Q&A: Continue reading “Apple's biggest acquisition”

Apple’s 3Q FY13 Review (Padcast)

Preview 3Q-13 screenshot

Using interactive graphics and narration, this latest Apple Earnings Review discusses Apple’s performance in relation of its historic performance as well as to expectations (published in the Preview) on the following topics:

  1. Guidance vs Actual performance: Now that Apple changed the way it provides guidance, are we seeing a new degree of precision in their signaling. We look at the history of earnings guidance and how effective (or not) the current method is in helping predict performance.
  2. Gross and Operating Margins analysis: What is the pattern of margins and how important are margins to the perception of competitiveness?
  3. Margins by product. How are margins allocated by product?
  4. Average selling prices for each product. Any surprises in Pricing? What was the magnitude, cause and significance of iPhone ASP drop.
  5. iOS product shipments. Comparison with expectations, trends and explanations. Overall iOS growth story.
  6. Cash balance and the effect on cash of share re-purchase.
  7. Sales growth and Earnings growth, a long term retrospective.

Duration is about 1hr.

As a reminder, the Padcast can be reviewed interactively users can access to the underlying data.

It’s available for download on the iPad for $19.99. Those who already bought the Preview will be receiving an updated version soon that includes the Review at no extra charge.

Introducing Asymcar

If Apple can have a hobby then so can Asymco.

Jim Zellmer and I were having fun talking about cars and thought why not record our conversations and put them up for others to listen. That’s how Asymcar got started.

Besides having fun, what we plan to do is use the auto industry as a lens to understand how disruption works. Whereas Asymco is a narrative on an industry that is dynamic because of disruption, we hope to make Asymcar a narrative on an industry that isn’t dynamic because of a lack of disruption. A sort of foil to Asymco (or maybe an Asymco Bizarro.)

The approach is to use stories that everyone can understand whether you care about cars or not. The inspiration was the TV program Top Gear which satirizes the adolescence of the male mind, and thus appeals to all. With Asymcar we hope to bring a rich set of new metaphors to describe similarly curious phenomena.

Check out the first Podcast: Tubular exoskeleton-type thing

Apple's 3Q FY13 Preview (Padcast)

Anders Brownworth and I got together on a Perspective airshow and recorded our conversation about Apple’s performance this quarter. We packaged it as a downloadable Padcast which you can listen to while looking at the motion graphics. After listening you can peruse the graphs and estimates at your leisure.

Requires an iPad of relatively recent vintage, the Perspective App and $19.99.

scene_006

Switcher

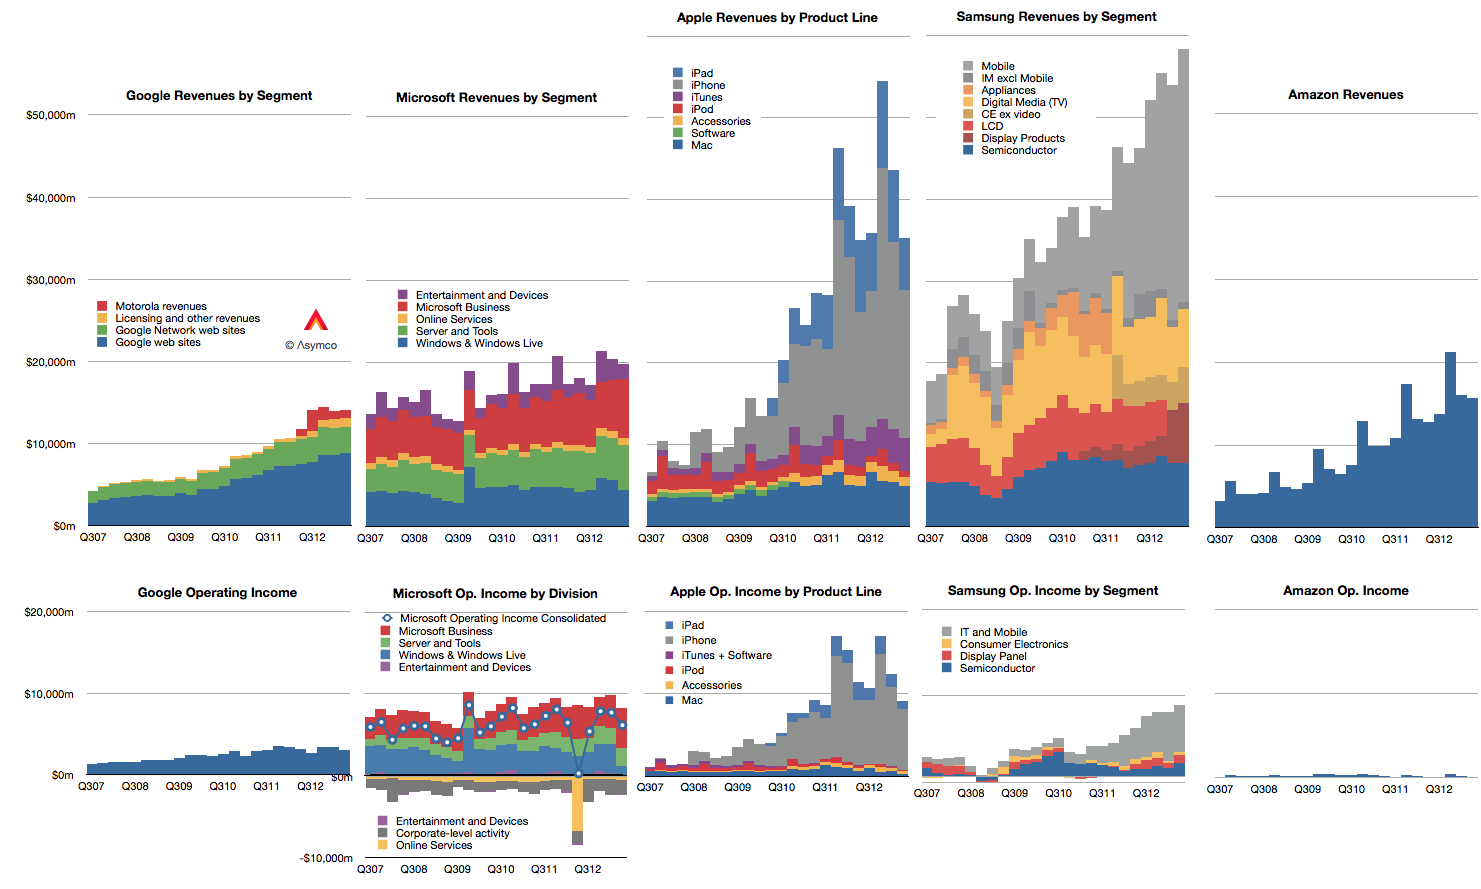
Nokia’s Windows (Smart)Phone performance was drowned out last week by Microsoft’s big announcement of the Surface inventory write-off. They are pieces of the same puzzle however.

First, a look at Nokia.

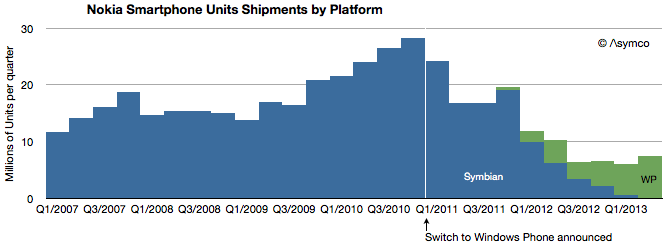
There were 7.4 million Lumia phones sold in Q2 with 0.5 million sold in the US. Although Windows Phones grew sequentially from 5.6 million the previous quarter, and up from 4.0 million in the same quarter last year, total smartphones are down y/y and nearly flat over the last four quarters. This is of course because Symbian phones have finally disappeared from volume shipments. The following graph shows the history of Nokia’s smartphone shipments.

Although it’s tempting to compare Lumia to iPhone (given the premium positioning in the US) the average price of €157 or $206 shows that Lumia is more adequately compared to Android. This is about a third of what Apple gets for its iPhones.

That’s not necessarily a bad thing. Nokia’s always had a knack for mass-market phones and certainly that was one reason Microsoft was attracted to them. Presumably, the promise of the relationship was to insert Windows Phone into the Nokia development and distribution pipeline, squeezing out costs and filling up channels.

Screen Shot 2013-07-22 at 7-22-3.24.21 PMThe problem for the brand has been that although priced at Android levels, volumes are nowhere near and the gap is widening. At current activation rates, Android is selling 16.5x faster than Windows Phone (assuming 90% of Windows Phones are Lumia). Continue reading “Switcher”

High Density #2: Tim Bajarin

High Density is an interview show where we try to articulate what it means to be great. My guests offer observations and insights into the transformation of business and society through technology.

Episode 2: Tim Bajarin

Tim recalls the beginning, middle and end of the PC industry and we discuss the causes of each.

via 5by5 | High Density #2: Tim Bajarin.

What's an Android user worth?

Excluding Motorola, Google’s gross margins have dropped for six out of the last nine quarters. They peaked at 65.8% in early 2011 but have now dropped to 60.4%. Including the drag from Motorola they are down to 57%.

Screen Shot 2013-07-20 at 7-20-9.52.38 AM

Gross margins include the effect of price, volume and direct costs of sales. Although sales have grown (see graph below), the pricing Google has been able to obtain (CPC) has fallen. The cause is unknown but there is a strong correlation between the growth in their mobile channel. For their part, management cites mobile as having an effect in reducing CPC though they caution that it’s one of many factors. Continue reading “What's an Android user worth?”

Asymco

Asymmetric Competition

Skip to content ↓