For more analysis of Apple & the industry, join us at ACTIVE 2025.

Estimates for Apple’s first fiscal 2013 quarter

I’ve postponed my estimates for the fourth calendar for a long time. The reason is that there have been conflicting data to deal with and I’ve been hoping for some clues to give clarity. Unfortunately, even though I waited, I have not received many clues. Here are the challenges we have to deal with in this quarter:

  1. Management gave very low guidance for the quarter’s earnings and sales. Normally this should not be a concern since the long-term pattern has been for them to “sandbag” significantly. For example last year’s fourth quarter was guided at $9.3 EPS while the company delivered $13.87, a 49% “beat” to their guidance. However Q2 and Q3 beats were only 7% and 13% respectively and if we assume a similar number (10%) for Q4 we get about $13/share which would be a year-on-year decline in earnings (down from $13.9). This has not happened for many, many years. Management explained this through a lengthy set of reasons including a shorter quarter (13 weeks vs. 14 weeks), new product launches, currency fluctuations, deferrals and unfavorable component pricing. Then again, similar explanations were used in the past with no reflection in what actually happened.
  2. Management also launched a large number of new products. This normally leads to a surge in sales. In fact, 80% of revenues would come from a new portfolio of products. Having such a broad launch quarter into a holiday, would normally imply huge growth. Not only is this a critical launch quarter for many products but they also rolled out the iPhone to more markets more quickly than ever: 100 countries in three months. The broad roll-out implies a steeper ramp in production and thus more volumes. This would also contradict the lowered expectations from the CFO. However… Continue reading “Estimates for Apple’s first fiscal 2013 quarter”

When will smartphones reach saturation?

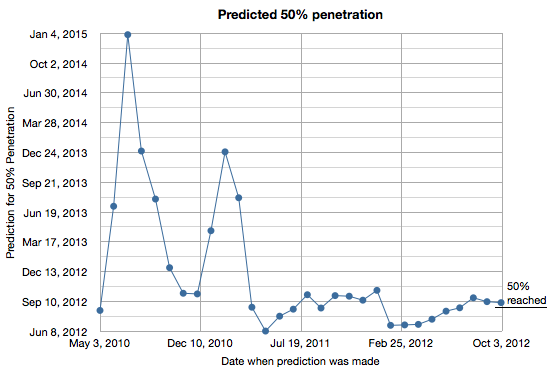
50% penetration for smartphones in the US turned out to be fairly predictable. I tracked my predictions based on comScore data and the results are shown in the following graph.

Screen Shot 2013-01-04 at 1-4-6.50.52 PM

I began making predictions in May 2010 and updated the estimate every month since. As the chart shows, the prediction converged to early September 2012 by early 2011. The actual date was sometime in late August 2012.

Continue reading “When will smartphones reach saturation?”

5by5 | The Critical Path #69: The Concentration of Power

A discussion on a forthcoming blog post titled “The Last Feature Phone”. Also why stock markets are intractable: the problem with understanding the motivation of buyers and sellers of equities, especially those who act on behalf of others as fund managers. Finally, a review of what’s on Horace’s to-do list for 2013 and a hint at the new 5by5 show High Density, the first episode which is linked in the show notes.

via 5by5 | The Critical Path #69: The Concentration of Power.

5by5 | High Density #1: Glenn Fleishman

Announcing a new 5by5 podcast: High Density.

In the first episode I interview Glenn Fleishman and talk about what it takes to be on Jeopardy (and how to win.) We also go on a journey into the lore and charm of The Economist and the curious state of modern journalism.

via 5by5 | High Density #1: Glenn Fleishman.

In search of Apple's microprocessor

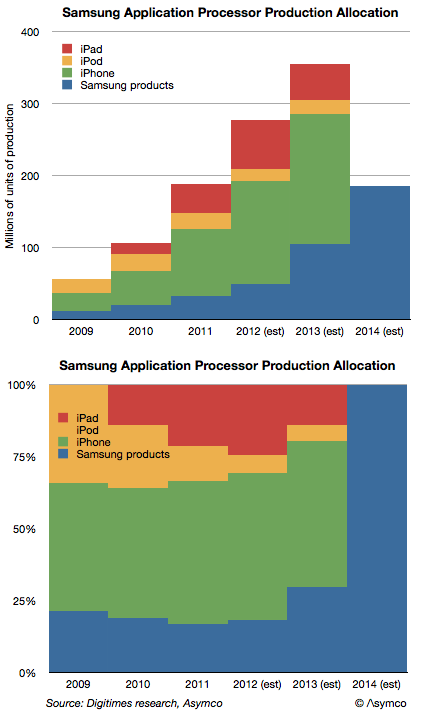
Digitimes Research published an estimate of the allocation of production of application processors by Samsung. It suggests that Apple will transition away from Samsung as a processor supplier during 2013 and stop sourcing altogether by 2014.

Most current capacity (nearly 70%) is said to be allocated to Apple’s products. The iPhone, iPad and iPod touch consumed an estimated 226 million processors in 2012. That demand is expected to increase but it will increasingly to be met by other suppliers in 2013. However, Samsung’s own products will take up some of the slack.

The following graph shows the estimated production schedule by customer.

Screen Shot 2012-12-28 at 12-28-9.57.37 AM

There are several questions that this data raises:

  • Does Samsung’s microprocessor production exceed that of Intel?
  • Who will produce Apple’s processors after 2013. Will it be one or more suppliers is also an open question.
  • Is Apple’s CapEx (est. $10 billion/yr.) being spent on some of this future capacity? A modern fab costs about that much.
  • As the iOS processors are Apple’s own designs, will Apple be integrating production and design?

Prior to his departure Intel’s Paul Otellini had begun speaking about manufacturing. He argued that the “fabless” model was no longer competitive and that design and manufacturing should be re-integrated.

I think we’re about to find out to what degree that will happen.


Call for Volunteers for Asymconf

If you are available January 29th and/or 30th in the San Jose area we could use your help.

We need eight people to help with registration, microphone relay, guides.

We also need five people to act as Camera Operators – we will provide Cameras and training, but any experience is a bonus.

We also need an Audio Mixer Operator – experience as a DJ is enough.


In exchange for a day of hard labor you’ll get:

  • Access to event (when not busy)
  • Access to reception and meals
  • A collectable Asymconf t-shirt

Send email to volunteer@asymco.com to apply.

Accommodations for Asymconf [Updated]

We recommend staying at the Hayes Mansion

200 Edenvale Avenue, San Jose, CA 95136

Phone: +1 866.981.3300

The workshops will be held here on January 29th.

(Three One more workshop seats are available).

Update: Workshops are sold out.

Update 2: Use this link to reserve a special event rate of $149/night. You can also reserve by calling the number above and asking for the Asymco rate.

The uncanny similarity between EU and US smartphone markets

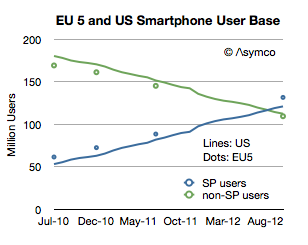
comScore released one of its rare updates to the EU5 (Spain, UK, France, Italy and Germany) smartphone market. Note that the data is claiming to show installed base and not sales in any particular period. What interests me is a comparison or contrast between the European market and the US market.

First, total users.

Screen Shot 2012-12-19 at 12-19-7.30.57 PM

The EU has about 500 million inhabitants while Europe overall has 731 million. The EU 5 total about 314 million which is very nearly the same as the US (311.6 million). Therefore the EU5 is a good comparable to the US in terms of population. As the graph above shows it’s also remarkably similar in its adoption of smartphones. Note that the scale reflects users and since the populations are very similar then the penetration should also be similar.


Asymco

Asymmetric Competition

Skip to content ↓