For more analysis of Apple & the industry, join us at ACTIVE 2025.

Half of US iPhones are repeat purchases

Canaccord Genuity analyst Mike Walkley writes in a note to clients today. “In fact, we believe iPhones are outselling all other smartphones combined at Sprint and AT&T and selling at roughly equal volume to all Android smartphones at Verizon.”

via iPhone Tops Sales Charts at Each of Its U.S. Carriers – John Paczkowski – Mobile – AllThingsD.

That’s useful data. Mainly because we can use it in combination with comScore data that tracks a different market measure. comScore’s MobiLens service tracks US mobile installed base. By measuring the difference between their stats one month to the next, one can measure the gain in a particular platform.
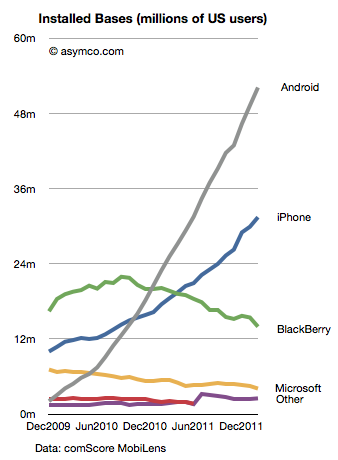
Comparing that gain with the sell-through rate in the same period can yield a figure for the number of units sold as upgrades vs. those sold to new users. Continue reading “Half of US iPhones are repeat purchases”

5by5 | The Critical Path #32: Mockumentary

Horace talks again with Dan Abrams about film budgeting, Kickstarter, pre-production, location, technology for production, and a surprise announcement. We also discuss the project-oriented nature of movie production vis-a-vis “pipelined” product development, the history of studios and how they evolved, Pixar and much. much more.

via 5by5 | The Critical Path #32: Mockumentary.

Show Notes and Links:

  1. Roger Corman blog post
  2. The False Profit Kickstarter page
  3. Discussion of the film by Bill Torgerson, another CP guest
  4. Steven Bach and the history of United Artists “Final Cut”
  5. Steven Bach on Wikipedia
  6. Technology drivers for the Impressionist era

This was quite a fun show.

Weighing the share of value created

Philip Elmer-Dewitt published a table from Piper Jaffray’s Gene Munster which has some interesting details. Munster has taken a four year “tech sector” view of value creation (and destruction) and tried to see if there is a bound on the value Apple can continue to capture. This “share of value” is one of many approaches to bounding an opportunity. You could consider “share of wallet” by measuring disposable income, or “share of eyeballs” by measuring screen time available or even “share of GDP”.

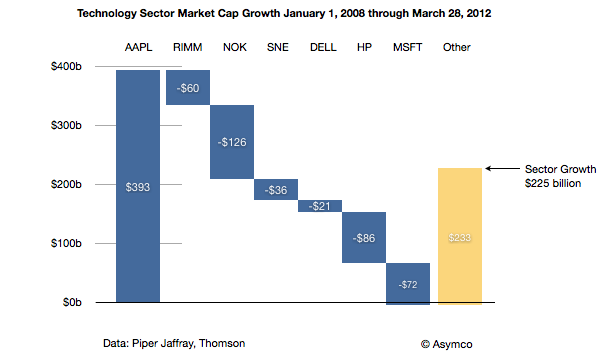
The attractive part of the share of value of industry is that we have an implicit way to see winners and losers, or the transfer of wealth from one group to another. I charted the data published as follows:

Seen in this context, Apple generated nearly as much value[1] as RIM, Nokia, Sony, Dell, HP and Microsoft destroyed. The rest of Continue reading “Weighing the share of value created”

The role of capital [1]

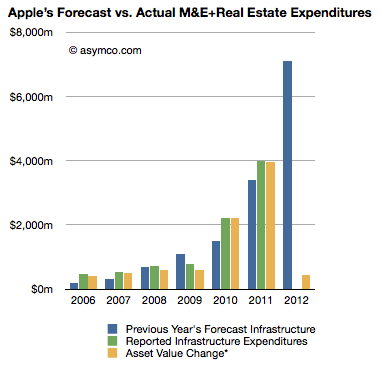
At the end of 2011 Apple’s net property, plant and equipment (PP&E) was $7.8 billion. This reflects $12.34 billion gross PP&E net accumulated depreciation and amortization of $4.5 billion. The depreciation and amortization increased by a total of $533 million and the gross PP&E increased by only $572 million. I say “only” because in the previous quarter PP&E increased by $1.42 billion. If we assume that this growth is equivalent to capital expenditures for the quarter, it’s also a very small amount given the company’s stated intentions to spend $7.1 billion during the fiscal year.

The gap is illustrated in the following chart:

Continue reading “The role of capital [1]”

Android Economics

Charles Arthur, writing for The Guardian, has noted that court filings seem to be revealing Google’s Android revenues. If this is the case, we have a significant breakthrough in understanding the economics of Android and the overall mobile platform strategy of Google.

The new data is a reference to a settlement offer Google made to Oracle of $2.8 million and 0.515% of Android revenues on an ongoing basis. The key assumption to make this data useful is that the $2.8 million offer represents 0.515% of revenues to date.

In other words, that revenues from 2008 to end of 2011 multiplied by 0.00515 results in $2.8 million. That implies that revenues from 2008 to 2011 were $544 million.

I think that’s a fair assumption. I don’t see why Google would offer a higher or lower royalty rate for years 2008 through 2011 than for years after 2011. The offer would seem to be 0.0515% in the future as well as retroactively in the past.

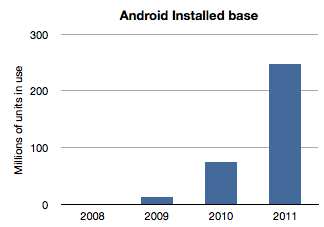
If we work with this assumption then the next question is how to distribute this $544 million over the four years 2008 through 2011? The installed base of Android has grown exponentially and it would seem logical to assume that revenues have followed in a similar pattern. Here is a chart of installed base given activation data supplied by Google.

If we assume revenues were distributed the same way we would get something like this: Continue reading “Android Economics”

RIM to give up

RIM’s CEO, Thorsten Heins was quoted as saying, “We plan to refocus on the enterprise business and capitalize on our leading position in this segment. We believe that BlackBerry cannot succeed if we tried to be everybody’s darling and all things to all people. Therefore, we plan to build on our strength.”

via RIM to give up most consumer markets | Ubergizmo.

RIM’s latest quarterly results show a continuation of the decline in sales that began in Q1 2011.

Here are the highlights: Continue reading “RIM to give up”

Top-down vs. bottom-up: Which market analysis method is appropriate when disruption is knocking

In terms of platforms, IDC expects a relatively dramatic shift between 2011 and 2016, with the once-dominant Windows on x86 platform, consisting of PCs running the Windows operating system on any x86-compatible CPU, slipping from a leading 35.9% share in 2011 down to 25.1% in 2016. The number of Android-based devices running on ARM CPUs, on the other hand, will grow modestly from 29.4% share in 2011 to a market-leading 31.1% share in 2016. Meanwhile, iOS-based devices will grow from 14.6% share in 2011 to 17.3% in 2016.

Via: IDC – Press Release – prUS23398412

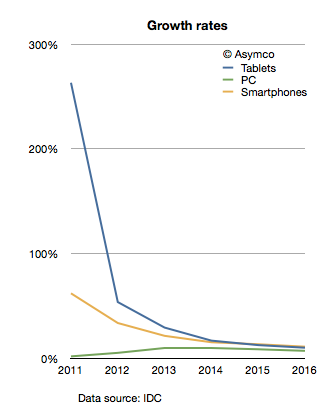
The company provides a stacked bar chart (follow link above) to illustrate their view of the market. I took the data they included and measured the implied growth rates for the product categories:

IDC is implying that in four years the tablet market will be growing at 10%, the Smartphone market will grow at 11% and the PC category will grow at 11%. Continue reading “Top-down vs. bottom-up: Which market analysis method is appropriate when disruption is knocking”

5by5 | The Critical Path #31: Greenlighting

Horace talks to Mike Schneider, a feature film development executive about what development means in the context of filmmaking. We cover the changes the development process faces, the impact of technology on business models and the future role of development in a more integrated film value chain.

via 5by5 | The Critical Path #31: Greenlighting.

Apple at $600. Who knew?

Apple’s share price has increased rapidly in the last few weeks. The rise to $600 was swift and broke the pattern of slow growth the the stock was able to obtain over the past few years. The level, however, shouldn’t have been a complete surprise.

I think Apple is going to $600…It’s really not that complicated. Apple has a number of key drivers in its business model which have yet to be properly priced into the stock because I think it’s very cheap at this level.

-Stephen Coleman, chief investment officer at Daedalus Capital

This prediction was made October 26, 2007. On that date Apple’s share price closed at $184.7. It may have seemed like a bold bet, but as Coleman noted, the reason why it would reach $600 was easy to spot.

The real story on how I get to that valuation doesn’t even involve the sale of (the Leopard operating system) or the growth in the Mac business. How I get there is through the iPhone itself.

What was not easy to tell was when it would reach $600. Continue reading “Apple at $600. Who knew?”

Asymco

Asymmetric Competition

Skip to content ↓