Apple Pay’s Pay Day

IN a recent release, Apple reported that “more than 90% of stores in the US, 85% of stores in the UK, and 99% of stores in Australia accept Apple Pay.” This is encouraging but a very small view for the global Apple Pay picture. How can we assess where Apple Pay is and how do we even measure success? My expectation six years ago was that Apple Pay would be a “$1 billion business” by 2020. Now that 2020 has ended, how was my six year prediction?

I always recommend counting customers rather than (or before) dollars so let’s begin with that. According to one source Apple pay users worldwide reached 507 million by September 2020. This is about 50% of iPhone users and therefore a decent adoption rate (starting as it did six years ago.) The data shows a growth rate of about 66 million in 2020 but a deceleration from 150 million the previous year. This data is obtained through surveys as there is no reporting from any participants.

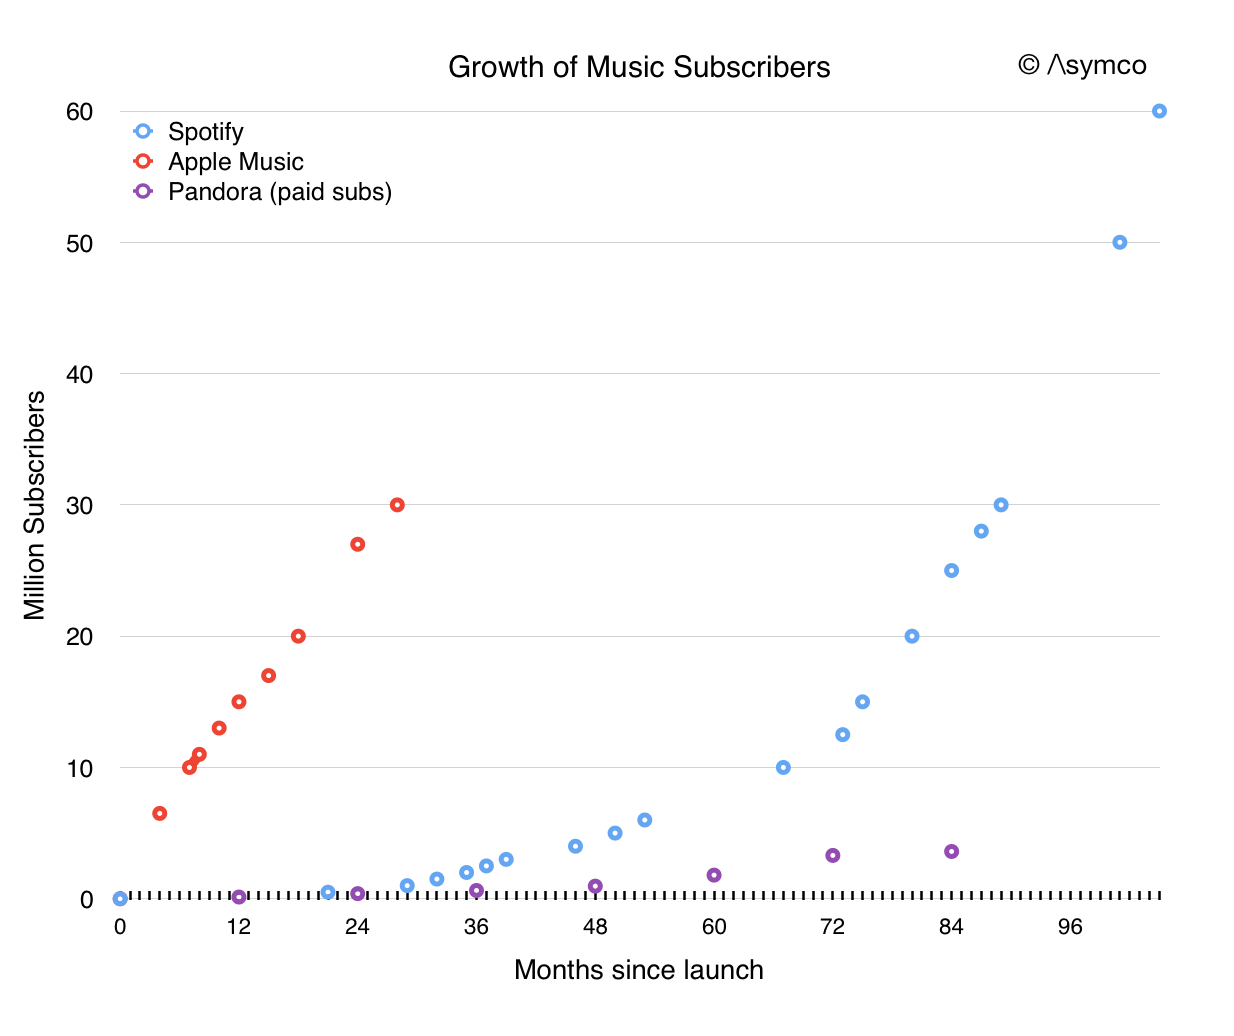
There is a smattering of other samples about transaction volumes, mostly behind pay walls, but the overall story of adoption is typical: an s-curve where we are either at the point of inflection or slightly after it. If we are half-way then perhaps saturation will occur in another six years.

More concerning is the distribution of these users. A lot of the data that is collected on mobile and online payments (and mobile wallets) is US only. Historically the US was a good place to measure technology adoption as the US was usually the leader. The automobile, PC and many other consumer technologies saw their market defined by the US.

But not so much anymore. The digital mobile phone broke the rule. Today mobile payments is breaking it again. Note that although the iPhone is over-represented in the US (as share of all phones) Apple Pay point-of-sale support is under-represented in the US.

According to one survey, in mid 2018, there were an estimated 38 million Apple Pay users within the United States, and 215 million outside (5.5 times more!) Outside the US mobile payments are nearly 100% accepted by default but in the US the support is patchy and characterized by active intervention to deny.

I’ve used Apple Pay everywhere in Europe without friction. From vending machines to highway tolls to drive-throughs, public transit and parking meters. I can recall one failure to do so in the last six months (a state-owned gas station).

The same cannot be said of the US. Where at WalMart and Home Depot there is the capability of support but an incomprehensible refusal to do so. One rumor about why Home Depot denies it is because they were hacked once and are paranoid about any technology. Walmart may be spiteful due to margin/cost, valuing a few basis points over customer satisfaction, convenience, hygiene and employee productivity. These holdouts are the laggards. Perhaps there is some pride in denying their customers a basic convenience but there certainly isn’t profit in it.

It gets even weirder when it comes to banks. In the US almost all banks immediately supported Apple Pay as an extension of their bank cards. In Europe the banks became the holdouts, rolling out support slowly and perversely.

So when you consider the dependencies of Apple Pay:

  • Sufficient number of users with iPhones/Watches (check)
  • Support from Banks (great in US, spotty outside)
  • Willingness of retailers to accept (sluggish in US, perfect outside)
  • Availability of points-of-sale equipment (universal by now

It’s an impressive achievement.

My expectation six years ago was that Apple Pay would be a “$1 billion business” by 2020. This was based on a take rate of 15 basis points ($15/$10,000 in transactional value). Juniper Research, which regularly examines payment transaction markets, now expects that Apple will see global Apple Pay transactions of $686 billion by 2024.

At that 15 basis point rate it amounts to $1.03 billion. Thus this particular research suggests that I was off by 4 years, making the $1 billion pay day a 10 year target rather than six.

But maybe that is no fault of Apple’s. The transaction volume is also equivalent to 52% of the proximity mobile payment market. Half the addressable payment market is a pretty good market share for a company holding 25% of the smartphone user base.

Analyst, analyze yourself

It’s common knowledge that sell-side analyst price targets for stocks are not taken seriously. The evidence is simply that no public accounting exists for their historic performance. It would be trivial to grade performance but it seems nobody bothers to do it.

It seems strange given the attention paid and repetition of these targets in financial media. When a “note” is published with an opinion and a target price the stock price can and does actually react. But why should it if there is no accountability?

Well, not quite zero accountability. Philip Elmer-DeWitt publishes analyst estimates (example) diligently. These estimates are presumed to be 12 month targets, meaning that at the time when the estimate is published the target price is assume to be reached 12 months hence. He does grade the performance of these same analysts (and more) in predicting quarterly earnings and revenue estimates for the just-ended quarter.

But an estimate for what *just* happened in the last 90 days is a lot easier than predicting how markets will react to all the information about a company 12 months into the future.

So how hard can it be to measure performance on price targets vs. just-ended quarterly estimates?

Here is my modest attempt: I note that Apple’s share price today is trading around $298 per share. I also note that we can recover the estimates from analysts exactly a year ago. At that time Apple issued a rare warning that its own estimates for the fourth calendar quarter 2018, issued about 60 days earlier would be quite a bit different than what will be released (in 3 weeks).

This compelled all the analysts to re-set their targets at the same time. What we ended up is a whole batch of January 3rd 2019 estimates for, presumably, January 3rd 2020.

Well, January 3rd 2020 is tomorrow. How did the estimates hold up?

The following graph tells the story:

Apple Share Price vs. a sampling of Analyst Estimates, Past and Present.

The green line in the graph represents the closing share price at weekly intervals (from about October 2016 until last week.) The blue dots represent various estimates. Note that they are 12 months since their issuance and that since estimates can come at any time the are not easily clustered.

That is except last year and the “big reset” when the estimates all were issued on the same day. I highlighted the range with a vertical line. Note that the closing price last week was well above the highest estimate and that the lowest estimate ($140 is less than 50% of the current price).

This is quite a big fail. Errors of 50 for a 12 month time frame are egregious.

A few additional observations:

The spread or variance of estimates is enormous. Far wider than what was the case 3 or 4 years ago. (I look forward to getting more data to perform this variance analysis). It’s peculiar to me that a larger, more stable business, as Apple is today, is more difficult to predict. To see even today a range in targets between $150 to $350 is bizarre.

Another observation is that very, very few targets were “accurate”. That is anywhere near what actually happened. To find these rare successes, look for blue dots placed directly or near the green line. The chances of a correct target is less than what can be attributed to chance. Again, I look forward to a larger data set to see if there is any set of analysts that perform particularly well or particularly poorly.

Again, we’re not describing here predictions about the stock market in general, or of macroeconomic indicators. We’re talking about predicting one single company’s stock price in a 12 month period. A company that receives a great deal of scrutiny and which publishes a surprisingly large amount of data about itself.

Now I don’t want to suggest that there is a better way to predict share prices. I will not try to do so because although it might be easy to predict earnings based on overall company strategy, processes and team (all well known) the share price is that data multiplied by a random number called “sentiment”. That sentiment can be summarized as the P/E ratio which wanders around aimlessly. I don’t think I have any way to predict sentiment one second into the future, never mind one year.

But even if I don’t think there is a method to the madness of sentiment, it seems dozens of people find it necessary to claim that there is one. But if you do, then analyze yourself. What did you learn from the mistakes? What is the theory you’re employing?

And if you don’t analyze yourself, then don’t expect to be taken seriously.

[Sponsor] IVPN: Your Trustworthy VPN

There is no such thing as a free internet. If you engage online you are being monitored and someone is looking to extract data from your actions. Your online life is under constant surveillance from social networks, data brokers, ad companies and others looking to “monetize” your actions. You don’t have to accept this.

IVPN was built by a team of security experts and privacy activists as a tool of resistance against constant online monitoring. When using IVPN on your personal devices, an encrypted tunnel prevents the logging of your browsing history, while web trackers and ads stop following you around.

IVPN was the first VPN provider to integrate the WireGuard protocol to their Android, Windows, macOS and iOS apps, helping you achieve lightning-fast connection speeds on any platform.

In addition, unlike most VPN providers, IVPN has strong ethical standards and rejects targeted advertising, paid reviews and misleading affiliates. Remember, you get what you pay for.

Join IVPN in taking a stand against surveillance. Begin with a free, no-obligations trial.

IVPN: Your Trustworthy VPN

iPods Pro

At time of writing (December 12, 2019) AirPods Pro delivery wait time is over 4 weeks. It’s been like this since they shipped. I tried stores in several countries and although units can make an appearance on a shelf, they sell out immediately.

AirPods are part of the “Wearables & Home” category for Apple which used to be called Other Products and include also the Watch, iPod, Apple TV, Beats and HomePod (among other items.) iPod revenues were broken out as recently as 2015 but as the graph below shows, there have been no specifics on any product in “Wearables & Home” since then.

Wearables, Home and Accessories in a historic perspective with the iPod.

It therefore falls upon us to estimate how much of the entire category is any one product. It’s been very difficult as the only clues lie in growth rates, sometimes cited for the Apple Watch and sometimes for “Wearables” alone. As far as I can tell from the available clues, the split is roughly as shown between the Orange and Green areas. Orange reflects estimate for Watch and Green everything else.

This analysis helped me conclude the Apple Watch overtook the historic “peak iPod” which occurred in the fourth quarter of 2007 at $4 billion. My Watch revenue estimate was $4.2 billion in the fourth quarter of 2018. This conclusion was confirmed by statements from the Company.

The problem lately has been that AirPods have become huge unto themselves. There is literally no information about AirPods sales as a product category. The only option is to guess Watch and subtract it from Wearables and then guess again the portion of “non-Watch Wearables & Home” that is AirPods.

Looking forward to the next quarter, I am expecting a 51% increase y/y for Wearables and 24% growth in Watch. This results in a Watch revenues about $5.2 billion and non-Watch $5.7 billion. Now if we assume $1.7 billion for non-Watch-non-AirPods (i.e. Apple TV, HomePod, Beats, iPod, other) then this quarter AirPods will have overtaken peak iPod.

Remember that iPod was the phenomenon which reset all expectations for Apple. It caused Apple to cease calling itself Apple Computer. It (at least psychologically) laid the foundation for iPhone and everything else that followed. In 2005 and through 2007 Apple was “the iPod company”. I remember people working in a large search engine company calling Apple “that media company” as a result of over-intellectualizing iTunes.

(One more footnote on the AirPods Pro is that at $250 a pair and $300 for Apple Watch, throwing in a case puts these attached accessories for an iPhone at roughly the same average selling price for the iPhone of a few years ago.)

For the AirPods to overtake the iPod highlights just what a phenomenal category Wearables has become. In combination with Home and other accessories the category is going to decidedly overtake the Mac, having already passed the iPad.

And so it goes, something dismissed as inconsequential–”does not move the needle”–ends up becoming a massive force of change. The iPod was that, the original Apple II, the Mac and yes, also the iPhone. It’s the asymmetry of humility that this happens over and over again.

To hear more about the profundities of AirPods Pro tune in to the next Critical Path podcast.

Boxy Suite: A Better Gmail Experience For Mac [Sponsor]

We love Gmail and Calendar, but we believe multitasking kills productivity. That’s why we’ve built the most minimal, yet powerful Gmail and Calendar apps for Mac. We’re partnering up with Asymco to give you an exclusive 30% discount: click here to get it.

Instead of a list of features, here’s what our users say about Boxy Suite:

  • Framer co-founder Jorn van Dijk: “Boxy Suite is the best way to use Gmail and Google Calendar on your Mac. I use it every day and love it.”
  • Zee M Kane, former The Next Web CEO: “Boxy makes G Suite beautiful and gives it those extra priceless features that should have been there from the start.”
  • Ryan Kulp, founder of FOMO: “Just downloaded Boxy Suite and already in love. Killed ~13 permanently open tabs with their suite of native clients.”

Try it for free and we’re sure you’ll kill many Chrome tabs too.

The iPad Operating System

WWDC 2019 included a vast list of releases and it’s quite difficult to summarize. The focus is always on software updates but this year the list seems more exhaustive than usual.

The highlights for me are:

  1. WatchOS now includes direct App Store access. This continues the separation of the Watch from the iPhone, on a trajectory that remains predictable.
  2. Hearing Health/Noise App/period and trends management extends the iPhone’s health maintenance “jobs to be done”.
  3. AR & Swift extend the platform through Reality Kit and Reality Composer and Swift UI.
  4. MacOS improves through a new Apple Music app, Sidecar iPad integration, Accessibility and “Find My” Mac offline beacons.
  5. iPad and Mac are beginning to share Apps with Project Catalyst.
  6. New Mac Pro and new XDR Display are quantum leapfrog leaps in the high-end performance computing market where Apple has lagged for a few years.
  7. Sign-in with Apple is a huge and much needed update to identity management on-line. A big deal.
  8. iPadOS introduced as fifth Apple OS. Rather than merging iPad and Mac which would be suggested by Project Catalyst, Apple preserves and sanctifies the modularity of form factors based on their differences rather than commonalities.

If there is one thing I took away as most significant it would be the iPadOS spin-off. I don’t quite know how this will change the fortunes of the iPad but in declaring itself a platform distinct from iOS it signals that iPad can evolve rapidly in a new direction. The promise and problem with the iPad has always been that it was great hardware held back by software that was not able to take advantage of it.

The core apps, interfaces and connectivity were all constrained, which is not necessarily a bad thing. Constraints make a system and the constraints of the iPhone made it great. Not having a stylus, not having a menu system and not having windowing meant the UX had to be drastically simplified.

But apparently the iPad could not evolve without a re-evaluation of these constraints. The last iPad Pro release hinted at what was coming: it had a full-size keyboard and an immensely capable processor and screen.

So we saw new features such as split view for the same app, Files folder, doc sharing, USB and SD drives support, Zip/Unzip, Desktop class Safari optimized for touch. Download manager, custom fonts, new text editing gestures (copy/paste/floating keyboard). Pencil latency improvement. All these changes are geared toward “productivity” or Pro use.

And yet, the iPad is not Mac. It will remain separate and target Mac non-consumers. Indeed there are three times more iPad users than Mac users and it’s quite possible that the iPad base can expand further with enhancement into productivity.

The iPad has not proven to be either an iPhone or a PC killer. It’s just in between. It’s not a bowl and it’s not a swimming pool. It’s a bathtub. And yes, bathtubs are never going to be as common as bowls but they have their uses and are not obsoleted by better water containers.

The Operating System idea here is a bit of a conceit. In terms of the kernel and the core APIs there are vast common grounds between all Apple’s OSs. But what Apple calls an OS is not just the core code but also the positioning of the idea _to developers_. By branding iPadOS the company is signaling to developers that they should think about the iPad differently.

To a large extent they already do. Coding for iPad has always required a different design approach. But now perhaps Apple is drawing an explicit line enforcing the distinction.

Going back to the list of highlights above, none of them is a “home run”, re-enforcing the idea that the company has run out of big ideas. But hitting 8 base hits yields the same result as two home runs. There is a consistent delivery of improvements here that can’t be ignored. There’s something to be said for polishing rocks until they turn into gems.

The Pivot

The iPhone is the most successful product of all time.

Over 1.6 billion have been sold. Including the iOS products it spun off, the total is over 2.2 billion. Of those 2.2 billion sold, 1.5 billion are still in use.

There are about 1 billion iPhone users.

Economically speaking, iPhone sales have reached one trillion dollars.1

Since the iPhone launched, Apple’s sales have totaled $1.918 trillion. Of those trillions about one half a trillion was accumulated in the form of  income.

Of that half trillion in income, $360 billion was paid out to shareholders2. and $131 billion was paid in taxes.

This sounds like a good business, but no business is good if it is static. What makes a business great is dynamism. The idea is to constantly maneuver for a new or enhanced way of doing business as technologies enable entrepreneurs to fundamentally change how value is captured or allocated.

The iPhone story isn’t static, the “pivots” or change in direction are several:

  • The App Store, a platform for collaborative innovation where millions of developers are offered the chance to improve the product.
  • Accessories, a licensing model for third-party hardware that works with the iPhone
  • Distribution through multiple channels
  • Integration with other Apple Products
  • The marketing of older products alongside new ones at reduced prices
  • An expanded product portfolio with a broader range of prices
  • Trade-in and financing options

Each of these initiatives contributed to the iPhone growth story but the biggest change in business model was the addition of services. Apple Services grew out of the iTunes business that pre-dates the iPhone and was established to provide content for the iPod.

In 2006, the year before the iPhone launched, Apple customers spent $3.3 billion on iTunes, Software and Services. By 2018 the spending rate was $80.5 billion/yr. It’s very possible that this year’s spending rate will reach $100 billion/yr. This new division is simply called Services today and consists mainly of third-party apps and third-party content sales as well as licensing.

Recently Apple launched a set of new services that it will offer itself. This includes television, films, financial services and news. Apple already has a music service of its own and file storage (iCloud) both of which are offered as subscriptions.

Apps are also allowed to offer paid subscriptions, and that total has reached 390 million, growing at 30 million a quarter with an expected total of 500 million by 2020. That amounts to one subscription for every other iPhone in use.

Some would argue that even with a $43 billion revenue rate, ($80 billion billing  rate)3 Apple’s business is still a hardware business and that comes with low margins, potential for disruption, non-recurring revenues and cyclicality.

This is not the case. Apples’s business has high margins (64% gross margin for services, 34% for products), has been resilient over 12 years while attracting hundreds of imitators at lower price points, and has loyalty and satisfaction which results in more than 90% re-purchase rates. Cyclicality is driven by seasonality and product lifespans, not competition.


This common misconception of Apple is why it continues to be valued at a deep discount to not only peer companies who are services oriented (Google, Facebook, Microsoft and Amazon) but also at a discount to the overall market (the S&P 500).

Apple, since its inception, has always been oriented around its customers, not its products. The questions asked by management are “what can the company do to deliver experiences and satisfaction” rather than “what products can the company build”.

Every company is bound by its capabilities but the best companies re-shape these bounds because they are defined by priorities.

A priorities-driven company habitually re-designs its processes and its resources. A resources- or process-driven company re-designs its priorities as its capabilities change.

Moving as it does between computers, devices, software, services, retail, logistics and manufacturing means that it’s not classifiable as an “x” company where “x” is an industry sector. Rather, the company should be classified by the set of problems it seeks to solve (e.g. communications, community, productivity, creativity, wellbeing).

This disconnect between what people think Apple sells and what Apple builds is as perplexing as the cognitive disconnect between what companies sell and what customers buy.

Companies sell objects or activities that they can make or engage in but customers buy solutions to problems. It’s easy to be fooled that these are interchangeable.4

Conversely Apple offers solutions to problems that are viewed, classified, weighed and measured as objects or activities by external observers. Again, it’s easy to be fooled that these are the same.

This analysis is, of course, applicable to any company. Here I’m using Apple as a lens. This is because it’s just so much easier to tell this story with the narratives and anti-narratives that are so widely disseminated.

  1. The milestone of $1 trillion iPhone revenues was reached in the fourth quarter 2018 during which time the stock price of Apple fell by 40%. []
  2. As a result, the number of outstanding shares has decreased by 29% []
  3. The difference is in the way Apple accounts for App Store revenues: declaring only the 30% portion of sales that it keeps as revenues, and not including the 70% that is paid out to developers. The “billing rate” is what consumers spend, the “revenue rate” is what Apple reports. []
  4. They are only correlated. Purchase decisions are not *caused* by a product’s existence. The real cause is a combination of need and supply and time and circumstance of purchase. []

Just in Time

The iMac launched May 6 1998, exactly 20 years ago. It is not the most significant computer to ever exist. It was a clear descendant of the original Mac which established the “all-in-one” desktop computer category. That category, to which it still belongs, is a modest segment. The last time Apple reported portable sales separately was in late 2012 when the desktops/servers and pro systems combined made up only 20% of all Mac sales by units. If iMac were 10% of Mac sales, it would represent about 2 million units in 2017.

Desktops evolved into laptops and personal computing evolved into pocket  computing. Becoming more personal means more intimacy and this is leading to wearable computing. There is more beyond that to be sure.

But the iMac is a historically significant machine. It allowed Apple to start on a new trajectory. It did this by first offering a financial lifeline. Sales of Macs, which were at the time the only source of revenues for Apple, increased from 2.7 million to 3.8 million a year. This at a time when Windows PCs were shipping about 100 million units. That was enough to ensure survival. Today Mac units are five times higher while Windows PCs are about 2.5 times higher. The following graph shows the impact of iMac on the Mac’s trajectory.  Continue reading “Just in Time”

When Watch surpassed iPod

The last time Apple reported iPod unit and revenues was for the third quarter of 2014. Thereafter the product segment called “Other Products” was used to include what was formerly the iPod segment and the “Accessories” segment. Exactly two quarters later Apple began to sell the Apple Watch. Apple Watch was not broken out as a separate product segment and remained a part of Other Products along with iPod touch, Beats, Apple TV, and Apple-branded and third-party accessories. Soon the HomePod will also join the Other products.

The combined iPod, Accessories and “Other” product sales are shown in the following graph.1

Note that an attempt is made to estimate the contribution of Apple Watch to the mix. The method is simple: if you can estimate the non-Watch sales trajectory then the Watch is the difference between Other total and this trajectory.

If we discount the iPod, the non-Watch revenues come down to Apple TV and Beats, mainly.  Note that the data shows the contribution of Beats (Q4 2010) but it’s hard to parse specifically the growth of Beats. Since the Watch launched we also saw the introduction of AirPods and new Apple TVs, both of which probably contributed to some growth to “Other excluding Watch.”

We can take a stab at the first 6 quarters of Watch by projecting Other with some nominal growth. Thereafter Watch can be modeled using growth assumptions. Apple stated that growth was above 50% during the past three quarters. There are a few quarters where we must make guesses but overall the picture that emerges, shown below, is fairly robust. Note that I’ve included estimates for the fourth quarter of 2017 assuming continuing 50% growth. This is driven primarily by the launch of the LTE-enabled Series 3.

The result is a cumulative sales value of $14.3 billion and a volume of 40 million units (based on average pricing assumptions).


But what most catches the eye is the transition from iPod to Watch. Watch entered nearly at the same time as iPod bowed out. Its contribution to sales seems to mirror the iPod as well. The interesting question then becomes if the Watch will eventually match and indeed exceed the revenues from iPod.

I’d say the better question is _when_ Watch will overtake iPod. From a revenue point of view, I believe next year’s fourth quarter will see the Watch generating higher revenues than the highest quarter for the iPod.2

In terms of yearly unit sales it may take longer. The biggest year for iPod units was 2008 when about 55 million iPods shipped. Watch is now running at about 16million. If it could sustain 30% growth then it would take until 2022. 40% growth would mean 2021 and 50% 2020.

It’s not easy to predict growth but my bet remains that Watch will get there eventually becoming the third most popular Apple product. Perhaps even second.

Overtaking the iPod is quite an achievement considering that the iPod was once synonymous with Apple itself. Although Watch may overcome iPod, Apple may never be known as the Watch company. That’s perhaps for the best. I’ve noted before that Apple was once seen as the Apple II company, became the Mac company then the iPod company. Now of course it is thought of as the iPhone company though it’s no more that than it ever was any of the other things.


  1. Two quarters include estimated iPod revenues: Q4 ’14 and Q1 ’15. The iPod contribution is estimated with a simple extrapolation using the previous four quarters’ average rate of decline []
  2. That was in Q4 2007 when iPod managed $4 billion. []

Orthogonal Pivots

Microsoft has announced that by the end of the year the Groove music service will be phased out. Users are being offered the option to move their music libraries into Spotify.

This brings to an end a long story of Microsoft in the music distribution business. It started nearly 15 years ago with technologies in Windows that allowed for purchase and playback of various media formats. Microsoft sought to enable a large number of music retailers to market music through its formats and DRM and transaction clearing.

Services such as AOL MusicNow, Yahoo! Music Unlimited, Spiralfrog, MTV URGE, MSN Music, Musicmatch Jukebox, Wal-Mart Music Downloads, Ruckus, PassAlong, Rhapsody, iMesh and BearShare and dozens of hardware players licensed Windows formats. Almost all of these services have shut down and the devices disappeared.

The next stage was to offer an integrated experience through the Microsoft Zune player and Zune Marketplace music service. This too failed and was replaced by the Xbox Music brand in 2012. On July 6, 2015, Microsoft announced the re-branding of Xbox Music as Groove to tie in with the release of Windows 10.

There was a time when Microsoft was thought of as the certain winner in media distribution. Inserting media into the Windows hegemony was classic “control point” strategy: owning the access points was a sure way to collect a tax on what transacted through the network.

Instead we are facing a market where media is consumed through new access points: phones, tablets and TV boxes. Netflix, Spotify, Roku, Google, Amazon and Apple are all offering distribution and some are investing in original programming.

It’s perhaps worthwhile to recall that Microsoft and Apple both started their media efforts around the same time. Apple’s iTunes is 16 years old and the iTunes Music Store opened in 2003, almost 15 years ago. Today Apple is transitioning to streaming with 30 million subscribers. The graph below shows the history of subscription growth to Apple Music and Spotify.

Apple Music is a small part of Apple Services (part of the orange area below).

On a yearly basis Apple Services are this year crossing the $50 billion gross revenue run rate. This year Apple released a new Apple TV 4K and is releasing a new smart speaker called HomePod.

The contrast between Microsoft and Apple is most visibly between the Mac and PC. But the story of how media paralleled mobility and how Microsoft struggled with both is perhaps a cautionary tale.

Microsoft saw the limits of modularity when new product categories emerged and when new user behaviors were created. They attempted to pivot into being more integrated but those efforts also failed. The efforts continue today with Surface devices; looking forward they will continue with AR/VR and perhaps a pivot of Xbox..

But the long arc of history shows how hard it is to succeed in vertical integration after you build on horizontal foundations. Generations of managers graduated from the modular school of thought, specializing rather than generalizing. Now they are facing an integrated experiential world where progress depends on wrapping the mind around very broad systems problems.

Entire industries are facing this orthogonal pivot: media, computing and transportation come to mind. Huge blind spots exist as we see only what we’ve been trained to see.