According to JP Morgan analyst Samik Chatterjee, citing Sensor Tower, Apple’s App Store revenue for May 2025, increased by 4.9% month-over-month (which compares to an average sequential increase of 2.3%) and an acceleration of year-over-year revenue to 13.0% in May versus up 11.8% in April. On a year-over-year basis, the App Store downloads increased by 3.1% in May (versus +5.8% in April) according to Chatterjee.
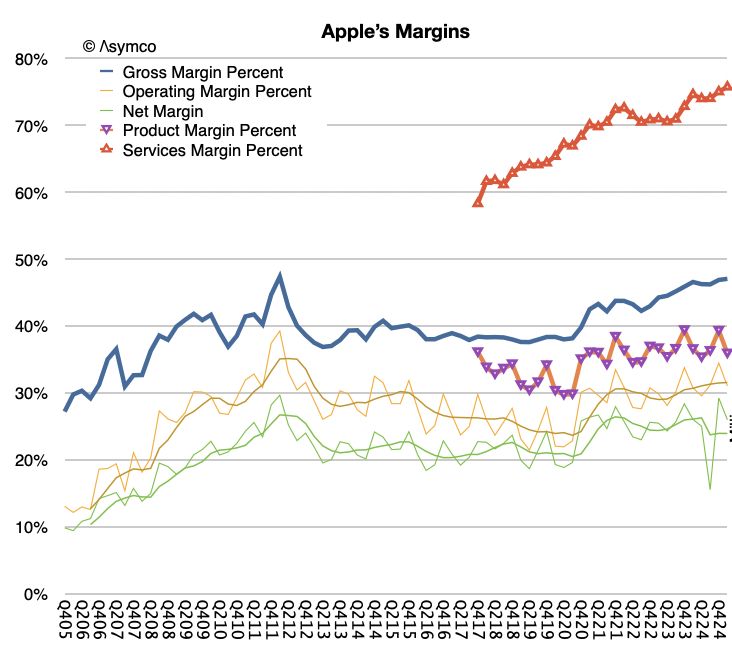
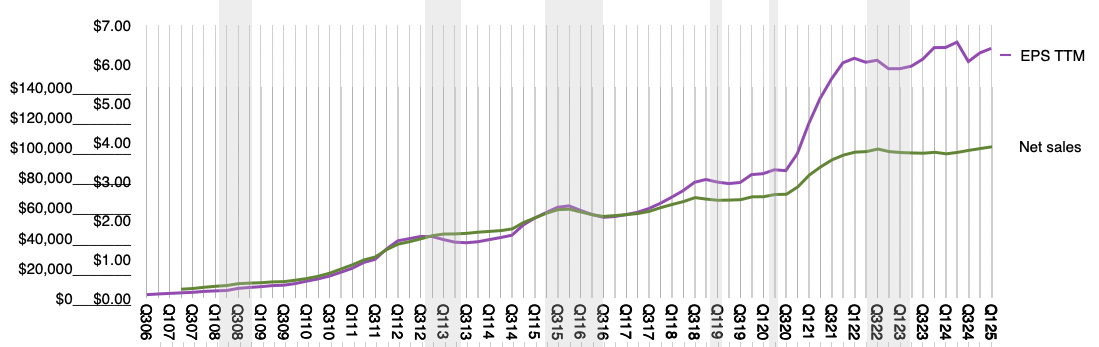
This analysis is based on app download sampling and may be indicative of the activities of consumers on the App Store. Services revenue in the first calendar quarter was $26.6 billion, up 12% year-over-year and at an all-time revenue record. Services gross margin was 75.7%, up 70 basis points sequentially, also an all-time record.
The world however seems to be having a problem with Apple Services. After years of skepticism of its relevance, now that it has achieved a run level above $100 billion/yr., it’s being criticized for being harmful to competition.
The comments that it’s unfair to developers or that it deters innovation are uninformed to say the least. What is missing from that analysis is that the App Store is only a small fraction of the entire ecosystem around Apple’s platforms and that the economic activity the platforms enable is immense.
Let’s learn.
Over the last year Apple reported a bit more than $102 billion in revenues for Services at a very high margin. The reason it was such a high margin was partly due to the fact the Services does book all payments from customers through the App store as revenues. In other words it does not include payments to developers as either revenue or costs. Those payments pass through but they are certainly part of the economic activity on the store. It would be indeed unusual for a physical store not to report what it pays for what it sells as part of revenues. But this is the basis Apple chose (or was obligated to choose) as the way to report App Store revenues.
Thus considering the payments to developers, the economic activity directly related to the App Store amounts to $120 billion/yr which includes commissions of about $30 billion/yr (last 12 months) and payments to developers of about $90 billion/yr (implying about 25% blended average commission rate.)
So including payments to developers the Services business grosses $186 billion/yr. of which 102 billion is reported as revenue, with the 75% gross margin and $90 billion is paid to developers “off the books”.
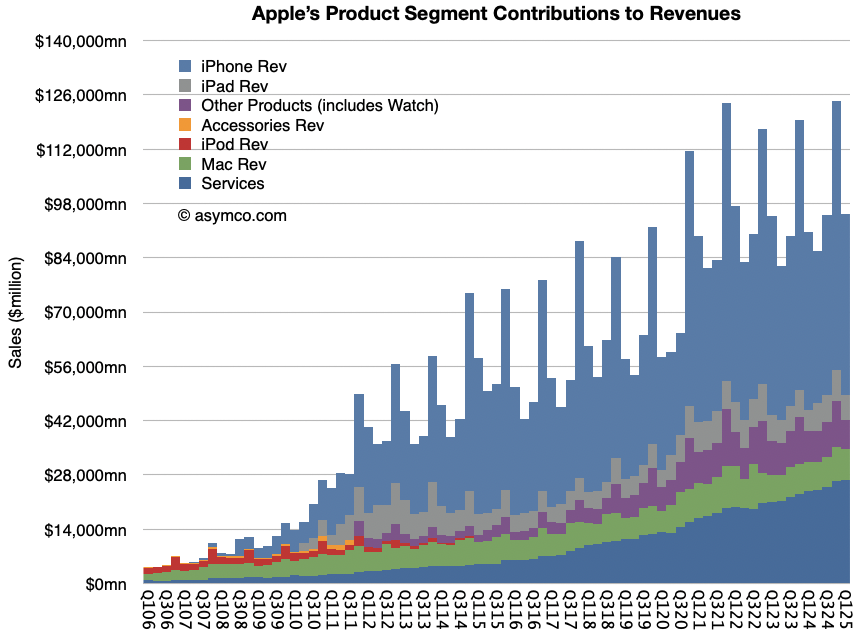
But that $102 billion in revenues is only about 30% App Store commissions. The rest includes many types of income: It includes:
- Advertising which consists of Apple’s own advertising services and third-party licensing arrangements notably the distribution fees for Google search (accounting for most of Googles “TAC” or traffic acquisition costs.
- AppleCare, Apple’s own extended warranty service.
- Cloud Services which provide content synchronization.
- Digital Content which not only includes the App Store but also stores for books, music, video, games and podcasts. Apple also offers digital content through subscription-based services, frequently bundled, including Apple Arcade, essentially a game subscription service; Apple Fitness, a personalized fitness service; Apple Music, which offers music streaming and on-demand radio stations; Apple News, a subscription news and magazine service; and Apple TV, which offers exclusive original content produced by Apple and live sports access licensed sometimes exclusively by Apple.
- Payment Services which offers Apple Card, a co-branded credit card, and Apple Pay, a cashless payment service.
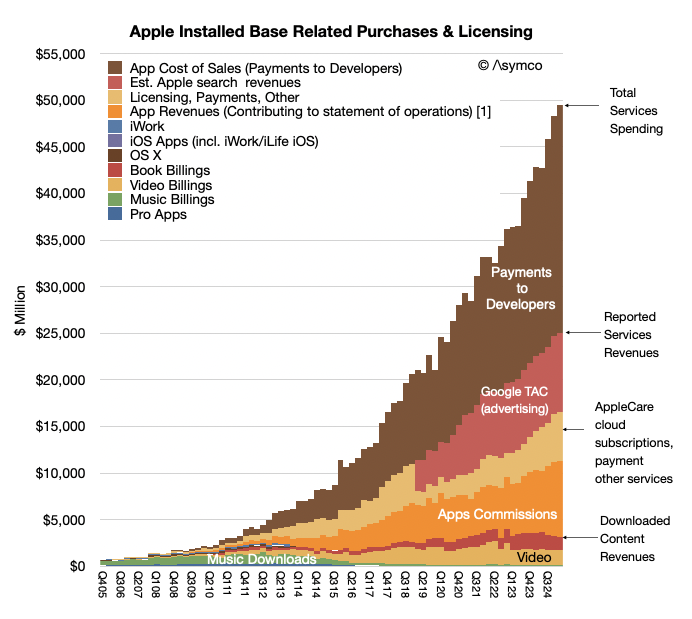
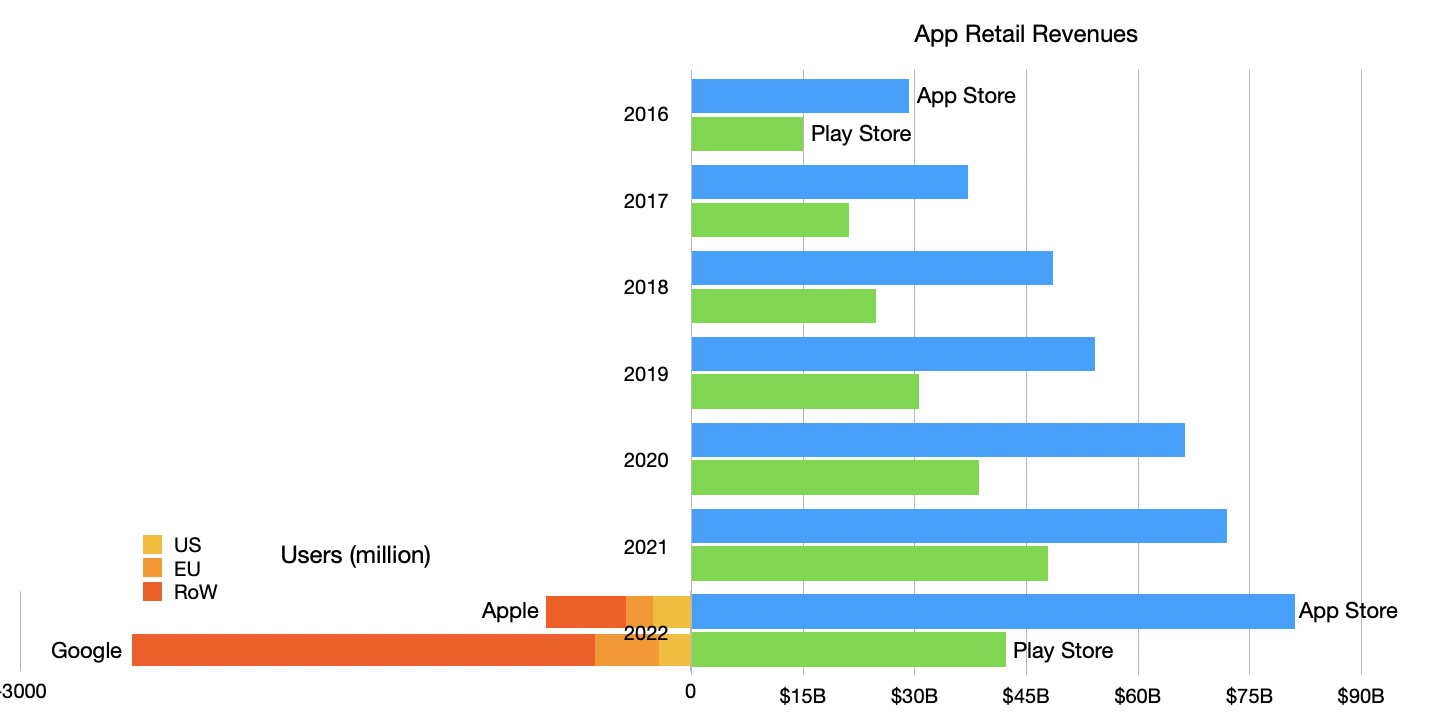
The quarterly view is summarized in the graph above. So a fixation on the commission is only a view into 16% of Services as an economic foundation (the orange area in the graph above).
But that’s still only a sliver of the whole picture.
A report written by Jessica Burley, Analysis Group and Professor Andrey Fradkin, Boston University Questrom School of Business has estimated that the global App Store ecosystem facilitated $1.3 trillion in developer billings and sales in 2024. As the report writers say: “For more than 90% of the billings and sales facilitated by the App Store ecosystem, developers did not pay any commission to Apple.”
How is this not visible? The reason is that this economic activity is distributed over the millions of purchases Apple users make through its iOS Apps every day. This includes traditional App Store “Billings” including paid downloads and in-app purchases, including subscriptions, that use Apple’s in-app purchase system and “Sales” which includes money spent by customers purchasing goods and services in general using any iOS and iPad OS apps. Apps developed by Apple such as Apple Music, Safari or browser apps such as Chrome are excluded from this analysis.
The economic activity unleashed by the App Store now reaches well over $1.3 trillion/yr. As the authors further explain,
While the present analysis captures the major app monetization strategies available to developers, the full economic impact of the App Store ecosystem extends beyond the estimates provided in this report, as the current methodology does not capture all of the ways in which the App Store ecosystem facilitates sales, or all of the benefits created by apps. For example, the App Store supports “companion apps” that raise the value of a company’s goods and services, including smart home apps and health apps. In addition, many apps now use different monetization strategies. As such, this analysis does not account for all the ways in which the App Store ecosystem creates value.
Furthermore the report breaks down the categories as Digital Goods and Services, Physical Goods and Services, M-Commerce (General Retail, Travel, Food Delivery and Pickup, Grocery, Ride Hailing), Digital Payment and In-App Advertising.
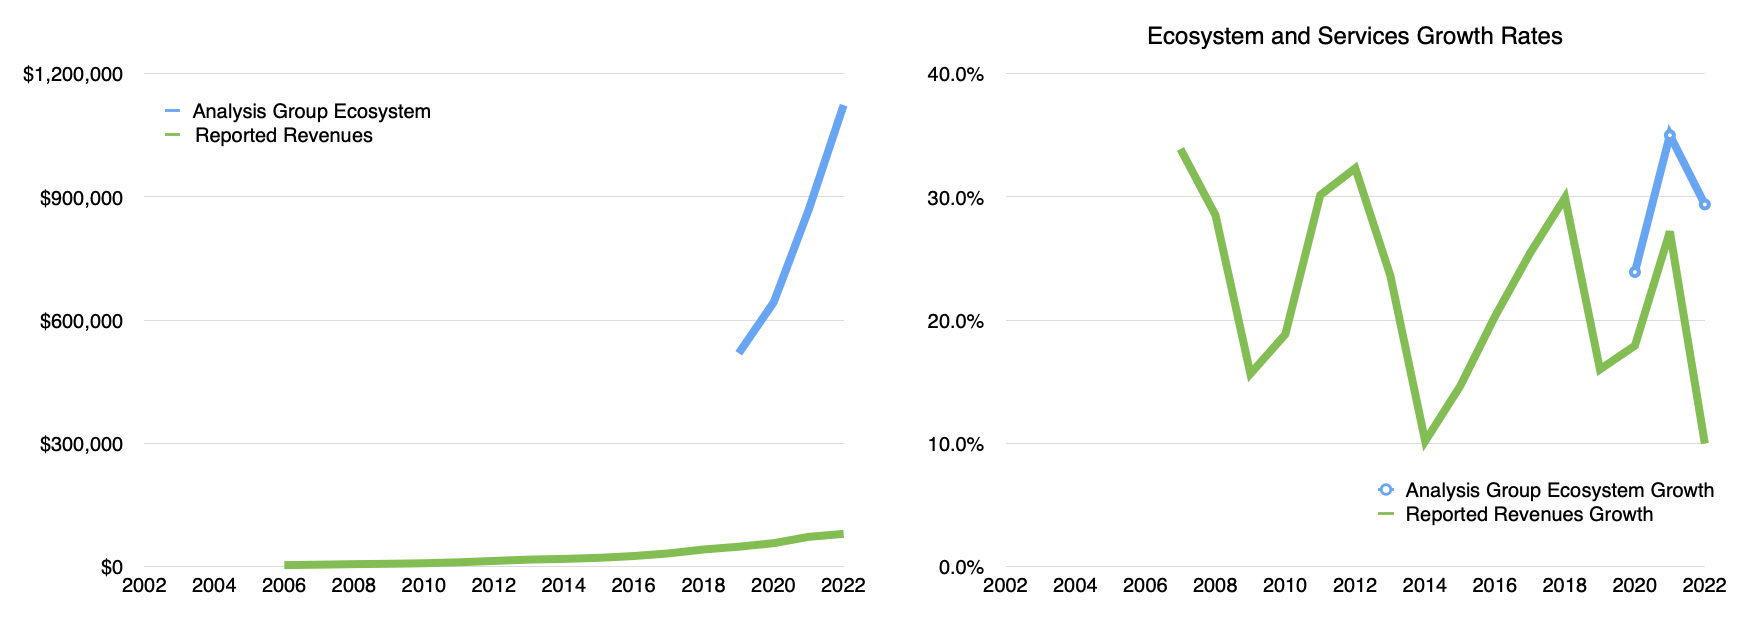
In addition the report estimates these categories from 2019 as well as 2024 providing a growth perspective: Over the past five years, the App Store ecosystem has more than doubled in size, increasing from $514 billion in 2019 to nearly $1.3 trillion in 2024.
It also identifies regional dynamics between the US, China, Europe (with select countries) and Rest of World (with select Asian countries).
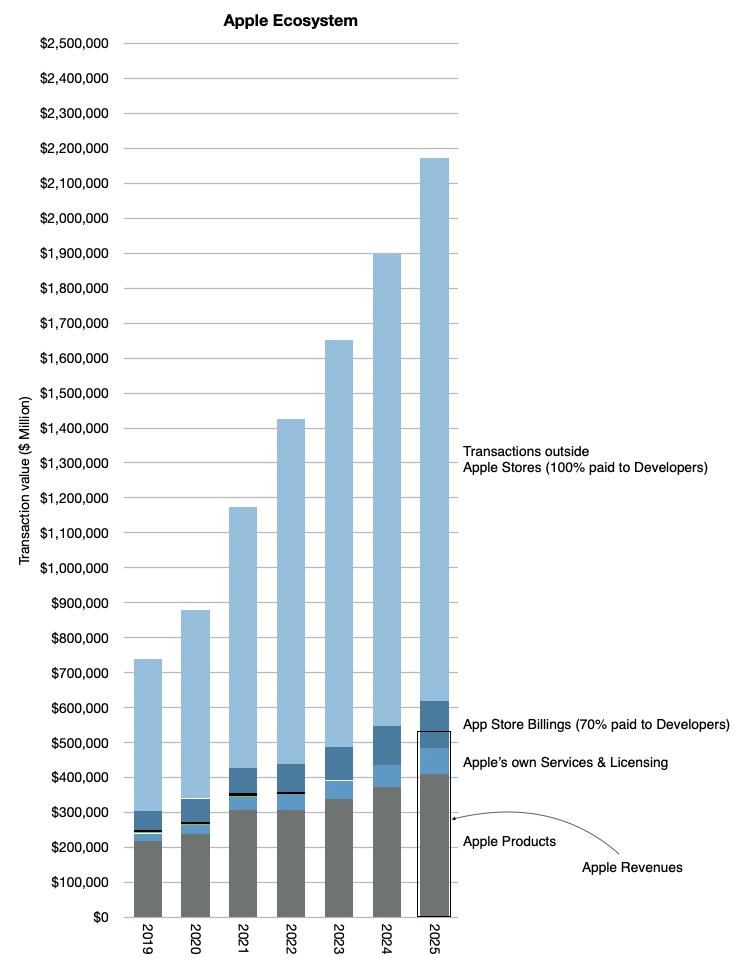
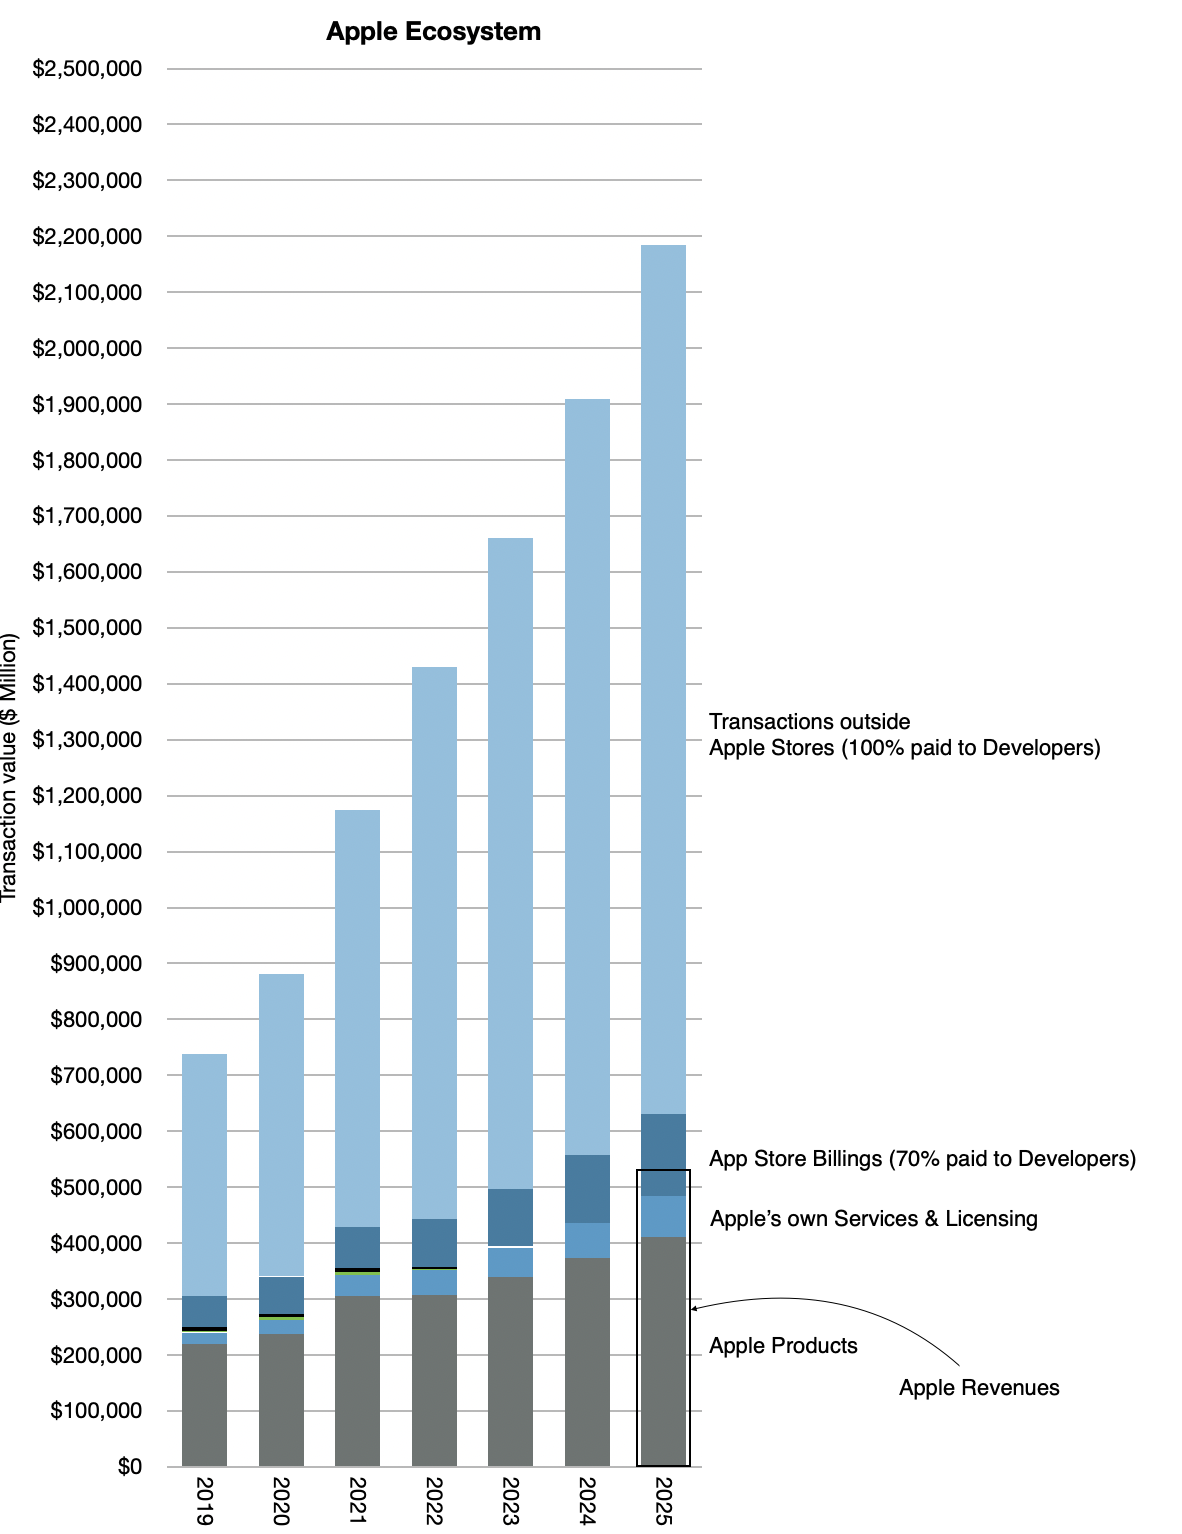
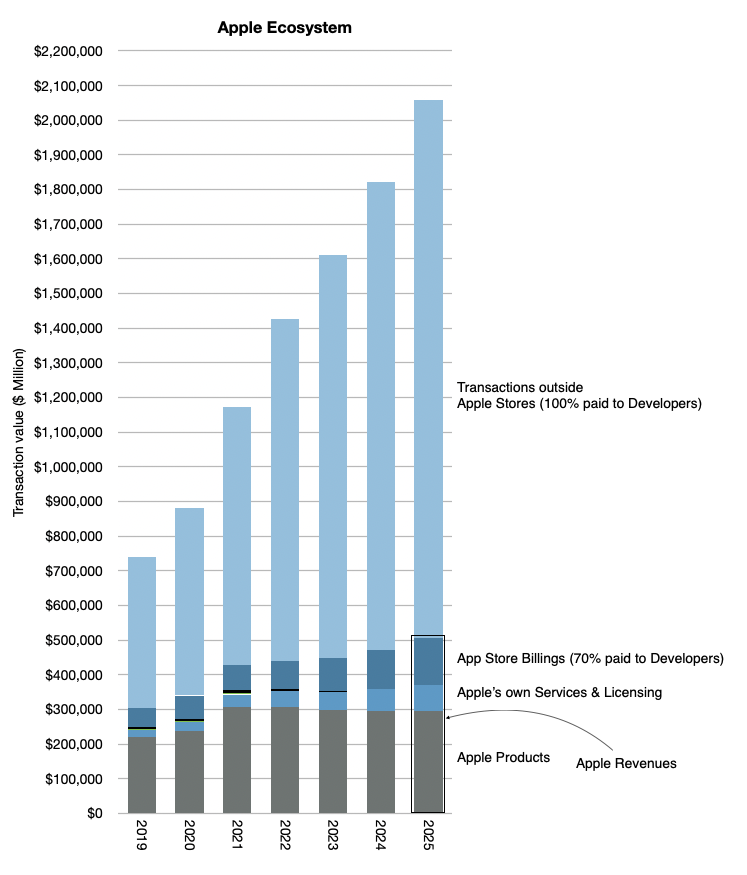
I’ve been keeping my own analysis of what I called the Apple Economy and it includes these transactions outside the App Store and Apple’s own products and services. If I were to subtract Apple’s own revenues from the total, for 2024 I was getting about 1.4 trillion (out of a total of over 1.8 trillion).
My point was always to estimate the economic impact of Apple beyond its own sales. This gave us perspective to assume that in 2025 the total would reach over $2 trillion. The graph below gives the perspective which also implies a doubling since 2020 to 2024.
The new report from Burley and Fradkin is a detailed, bottom-up analysis which quantifies what was perceived as the economic value of Apple being far more than what the financial data records.
Bill Gates once stated in reference to Zuckerberg’s assertion that Meta was developing a “platform” that it’s not a platform unless the economic value of everybody that uses it exceeds the value of the company that creates it.
Apple captures about $30 billion as sales but delivers over $1.3 trillion in sales, a multiple of 43! I would call that generous. In addition it doubles the market in 4 to 5 years. I’d call that market expanding not constraining. Finally, it’s a market that Apple created out of nothing. I’d call that market creation not destruction.
If judged on the question of creation and satisfaction of the customer, i.e. the ultimate purpose of the firm, the App Store and Services in general has satisfied 1.4 billion people. That they are spending over $1.3 trillion and doubling in 4 years is nothing short of astonishing.
We’ll discuss this topic and other topics related to Apple at ACTIVE: The Apple Investor Conference, which takes place on next Tuesday, June 10th, the day after the WWDC25 keynote.