Apple's growth vs. top ten largest tech companies

In the last article I described growth vs. P/E and price change for the largest “ultra-large cap” companies, of which Apple features prominent.

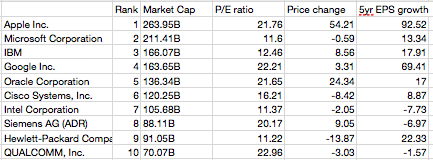
In this article I take the same analysis to the top ten largest technology companies (by market cap, see table at bottom).

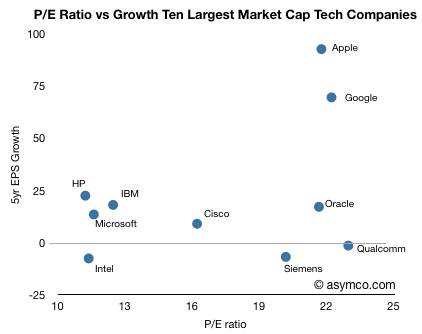
In this comparison, Apple no longer has the largest P/E ratio. Qualcomm, Google and Oracle are all at similar levels of valuation relative to earnings, however Apple’s growth outstrips them, only with Google in the same quadrant.

Note the “Wintel” cohort consisting of Intel, Microsoft, HP clustered around the Low growth, low valuation quadrant in the lower left (coincidentally co-located with IBM). Oracle, Qualcomm and Siemens show high valuation with low long-term EPS growth. Cisco is somewhat on the fence.

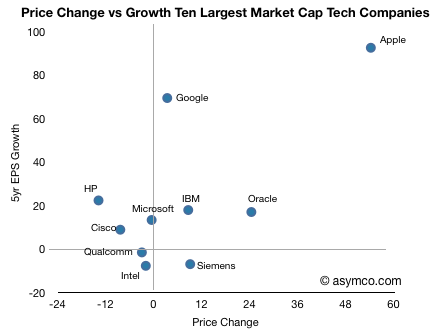
When comparing how the market has rewarded growth through share price appreciation, the correlation to growth is much better. Google seems under-rewarded.

Data follows:

Apple's growth vs. top 10 largest market caps

Apple’s stock price has been rising. Although it’s still priced at a P/E of 22 while facing near term EPS growth well above 50%, this is belated recognition of the potential of the iPad and the iPhone.

However, as it has grown, Apple’s valuation is now not only higher than any other technology company but it’s nearly the most valuable company on the planet. There is a theory that ultra-large market caps are reserved for companies that are past their prime. Sometimes this is attributed to the law of large numbers: that conclusion that big numbers cannot grow much bigger because compounding growth is exponential whereas markets are limited and become quickly saturated.

The trouble with this theory is that “large” is relative; large is often simply “the largest”. Large market caps are not what they used to be. During past booms, large caps touched a trillion dollars. Today, the largest market cap is merely $314 billion.

So I don’t put much faith in large number “laws”. The real question of under/over-valuation rests on whether the company is growing or not. Valuation is simply the net present value of future free cash flows (plus assets). So the most important determinant of current value is growth in cash flows.

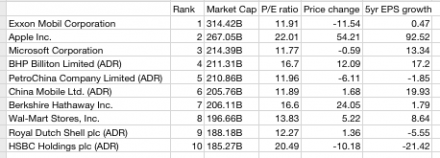
It’s fairly easy to assess this: compare P/E which is a proxy for valuation with EPS growth. The following chart does this for the top ten largest market caps traded on US exchanges (as listed by finance.google.com).
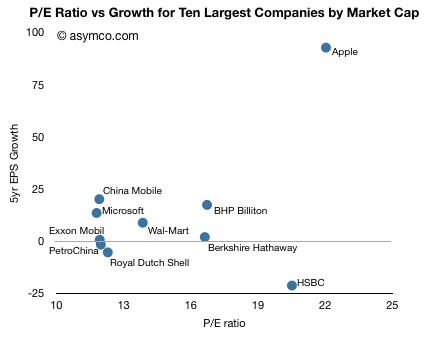
One should see some correlation between the two variables, but given the 5 year time frame, many of these companies showed large volatility. There are outliers like HSBC which has a rapidly rising value even though it was badly affected by the credit crunch.

The other outlier is Apple. The company showed 93 percent EPS growth over a five year period and has a P/E of 22. The company with the next highest total value (Exxon Mobil) had 0.5% growth with a P/E of 12. The company with the next lowest total value (Microsoft) had 13.3 percent growth with a P/E of 12.

For an ultra-large cap, Apple’s growth is unprecedented and extraordinary. It’s in fact off the scale. The average growth of the other 9 top caps is 3.6 percent!

Apple’s growth is a factor of 25x higher. The P/E is only 1.6x higher.

The result has been a much higher appreciation in the stock price as shown in the following chart.
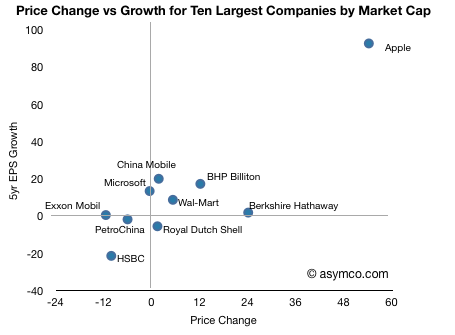
So it’s clear that Apple, in this peer group, is far from ordinary.

Data follows:
Per Lindberg predicts things

“The N8 is certainly a step in the right direction, it’s much more multimedia,” Per Lindberg, an independent technology analyst at MF Global in London, told Marayam Nemazee on Bloomberg Television’s “Countdown.” “But whether it will move Nokia’s market share upwards is more debatable,” he said adding that Android phones are becoming an “formidable force.”

via Nokia Says Preorders for N8 Smartphone Are Strongest Ever Seen – Bloomberg.

This is the same Per Lindberg who, in January of this year, reiterated his February 2009 Sell rating on Apple and the entire smartphone industry:

“There is no doubt, in my mind, that the whole sector is hugely overstretched,” says the London-based physics PhD and MBA graduate who joined MF Global Ltd. in 2008 after 10 years at investment bank Dresdner Kleinwort.

“The whole sector is priced as if the average player would sustain 25 per cent margin in eternity,” he adds.

“It’s bordering on absurdity. This will end in tears.”

He is willing to use the b-word: “Many stock bubbles are generated by sell-side analysts generating enthusiasm for the companies they cover.”

To date however, it’s Mr. Lindberg’s call that’s been the costly one for investors. He has maintained his sell rating on Apple since early February of last year, causing investors who followed his advice to miss out on a more than 110-per-cent surge in the share price.

Meet Apple’s sole skeptic – The Globe and Mail

In February 2009 Apple’s stock price was $89. Yesterday it closed at $267.

Quarterly Earnings Multiples: The new normal?

Based on the new iOS units numbers released I revised at the numbers for next quarter and it’s very probable that EPS will be over $5.25.

As recently as 2007 Apple was priced 50x one year’s earnings.

Now it’s priced 47x one quarter’s earnings.

Should we consider applying old yearly earnings multiples to quarterly earnings as the new valuation normal?

Apple trading at a discount to the S&P 500

Flush with $45 billion in cash and investments ($50 per share) and no debt, Apple sports an enterprise value of about $190 per share. Compare that to $15 of earnings this year and enough catalysts to make next year’s estimate of $18 seem easily attainable, and you have a stock that actually trades at a discount to the S&P 500.

via Why Apple’s Stock Actually Looks Cheap — Seeking Alpha.

This is not news around here

Apple sales by product line

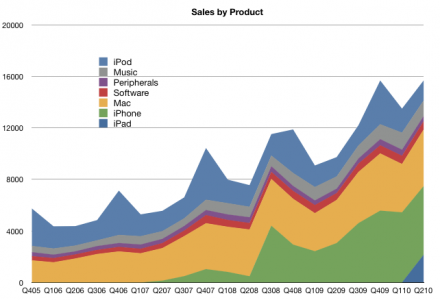
The following chart shows the value of sales per quarter (in $million) since the beginning of 2005. What’s interesting to note is that more than half of sales is contributed by products which did not exist three years ago (iPhone and iPad). Music and iPod did not exist 10 years ago.  It’s entirely appropriate that Apple removed “Computer” from its name, though they still sell mostly computers of a different kind.

Apple's Valuation Struggle Continues

asymco | Apple’s Valuation Struggle.

As despondency over Apple’s 75% earnings growth rate continues, it’s time to revisit the historic P/E in contrast to growth for the company’s earnings.

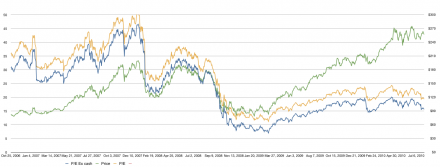
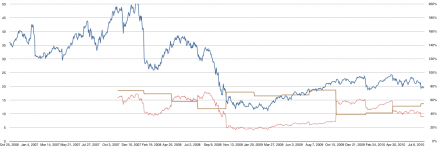
The latest chart (below) shows the company’s P/E ratio (in blue, left scale) vs. the trailing twelve months rolling growth rate (in brown, right scale) and the ratio between these two (in red, right scale).

The red line can be considered a form of PEG (Price over Earnings over Growth) with the caveat the the Growth is trailing not forward and hence is based on actual data not fictional analyst “consensus”.  I call this PETG (Price over earnings over trailing growth).

The actuals show that Apple’s price to trailing growth ratio is dropping to lows unseen since last year when the recession was still in effect.  At PETG below 20 the predominant sentiment displayed is extreme pessimism. 100 could be considered an even balance between pessimism and optimism. It now stands at 35.