Tim Cook's comments on Apple Stores, illustrated

Yesterday Tim Cook spoke at the the 2013 Goldman Sachs conference:

There’s no better place to discover, explore and learn about our products than in retail. It’s the retail experience where you walk in and you instantly realize this store is not here for the purpose of selling. It’s here for the purpose of serving. I’m not even sure “store” is the right word anymore. They’ve taken on a role much broader than that. They are the face of Apple for almost all of our customers

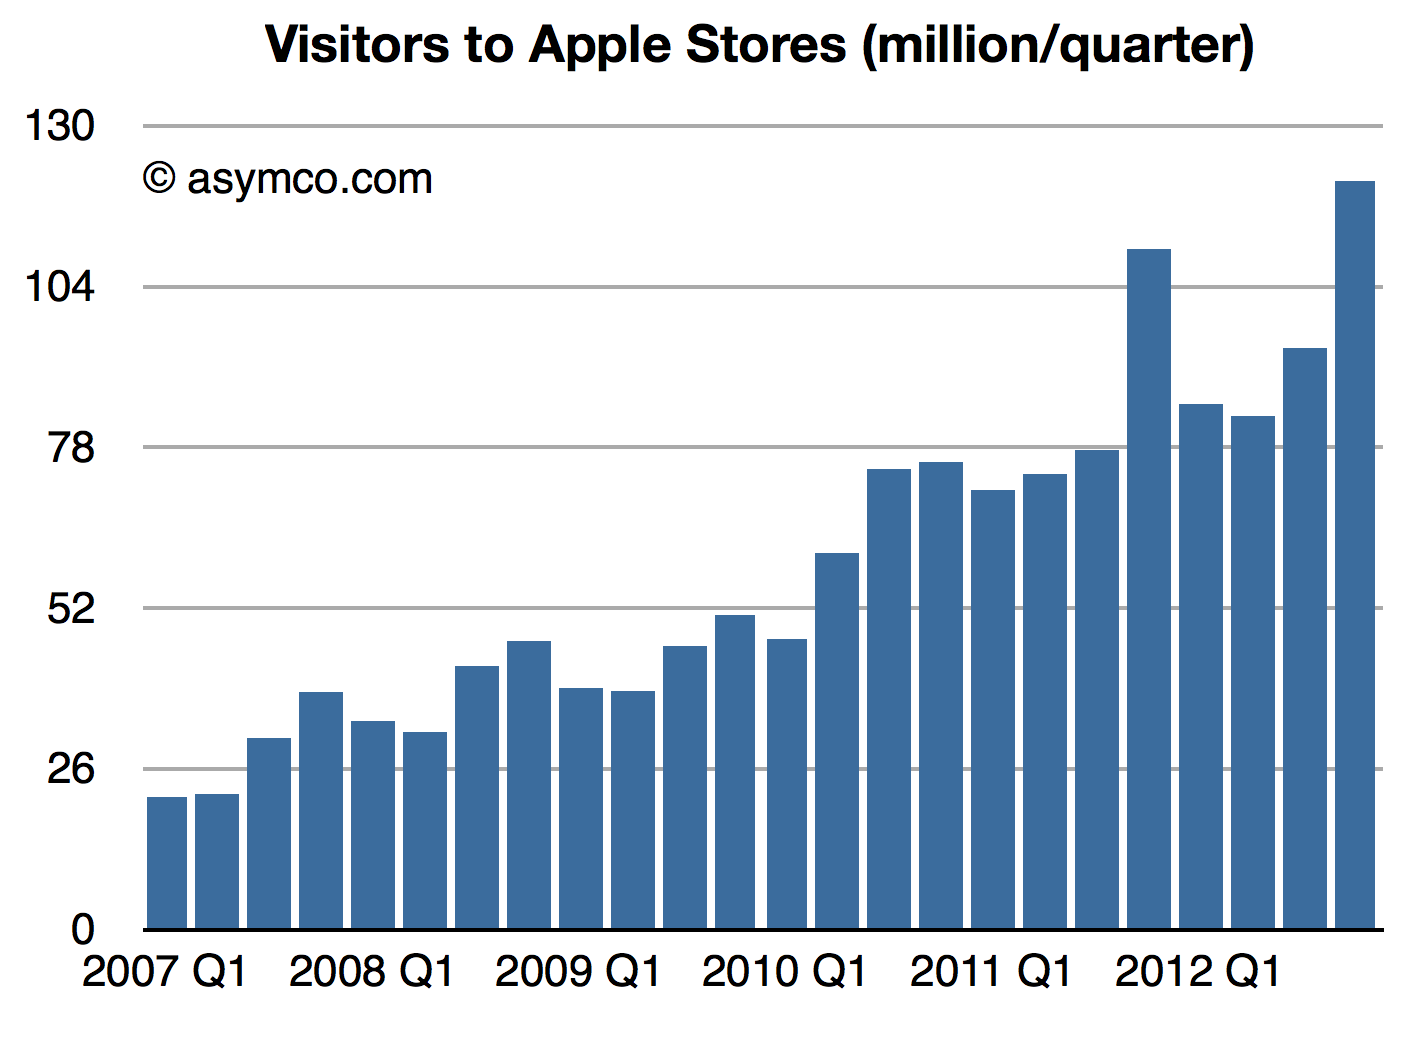
Last quarter, we welcomed 120 million people in our stores.

Screen Shot 2013-02-13 at 2-13-1.46.24 PM

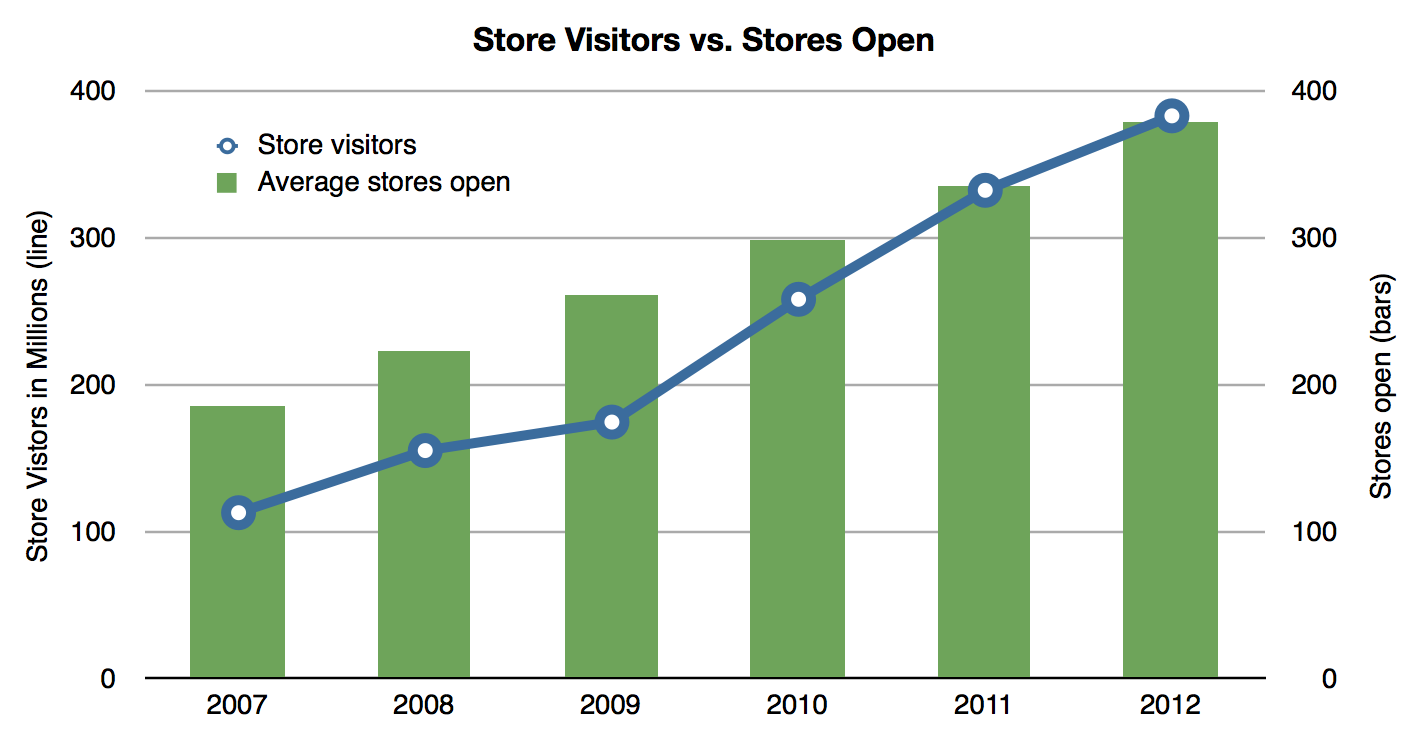
We only have a little over 400 [stores]. Last year, we welcomed 370 million into the stores.

Screen Shot 2013-02-13 at 2-13-12.51.57 PM

We’re closing 20 of our stores and moving them and making them larger this year. And in addition to that 20, we’re adding 30 more. Those 30 will be disproportionally outside the U.S. That gets us in 13 countries. Continue reading “Tim Cook's comments on Apple Stores, illustrated”

Right on Cue

On February 6th, 2013 Apple reported that a total of 25 billion songs had been downloaded from its iTunes music store. The previous definitive value was in October 2011 though there was mention of “more than 20 billion” in November. App download totals have recently been much more frequently updated as the following chart shows:

Screen Shot 2013-02-12 at 2-12-2.17.06 PM

[I estimated 21 billion for the November total.]

The latest two data points point to a surge in iTunes song download rates. Prior to last fall the download rate seemed to be hovering around 10 million songs per day. Continue reading “Right on Cue”

Counting stool legs

As Apple introduced a new set of revenue categories, the performance of its “minor” businesses has become clearer. The changes include re-statement of what used to be called “Software” revenues as part of iTunes. Apple Software includes sales of OS X, iWork and its pro tools. These products are now sold through the Mac App and since that is a part of iTunes its inclusion makes sense.

However, we have to understand that iTunes now is a blend of many business models. Some, like music, use a wholesale revenue recognition method and have very low to zero margins, others, like eBooks and Apps, are sold using an “agency” revenue model with potentially higher margins and some, like Software, are recognized at full value with very high margins.

When re-stated this way, iTunes becomes much more than a “break-even” business. My own estimate for its gross margin as currently reported is between 15% and 17% but it could be even higher. This allows the following picture to emerge:

Screen Shot 2013-02-11 at 2-11-12.06.08 PMThese graphs show contributions to Revenue and Gross Margins of the various reported product categories. Note that restatements for Accessories and iTunes only extend back to Q4 2010 and the older “Software” is still shown for earlier periods.

Note also that Accessories are now including some of the revenue that used to be reported as part of iPad and iPhone revenues. This was discussed in more detail here.

There are several observations we can make: Continue reading “Counting stool legs”

5by5 | The Critical Path #72: Bingewatch

We take on the future of TV again, given the developments and experiments hitting the news. Hanging in the air like a big matzah ball is the question of a catalyst to bring long form video to the age of software. Not just digital production and distribution but an integration of software into the product itself. We get there via a quick recap of Asymconf California.

via 5by5 | The Critical Path #72: Bingewatch.

Show Notes & Links

Margin Call

During the fourth quarter 2012 Apple’s margin fell to about 38%, a level not seen since two years earlier and down from a peak of 47% in Q1 2012. Does this lower margin foretell lower prices or a loss of competitiveness?

Obviously not.

Gross margin is a function of Sales (aka revenues) and Cost of Sales. Gross margin as a percent is calculated with the following formula: (Sales-Cost of Sales)/Sales. If dealing with a single product, Sales itself is the product of shipments and price/unit but since cost of sales is also a product of shipments and cost per unit, the shipments numbers cancel each other out and the gross margin reduces to the ratio of (Price-Cost)/Price.

So a margin drop can only be caused if one of three things happened:

  1. Prices dropped
  2. Costs increased
  3. Both prices dropped and costs increased.

We can easily find out which of these was the cause in the fourth quarter because we have volumes and prices for all of Apple’s products. We can also derive total costs based a total gross margin. These are illustrated in the following retina-friendly diagram.

Screen Shot 2013-02-05 at 2-5-11.25.16 AM

Continue reading “Margin Call”

Apple's Calendar Fourth Quarter 2012 Growth Scorecard

The fourth quarter of 2012 was 13 weeks in duration while the fourth quarter of 2011 was 14 weeks. The difference implies that a comparison of revenues should be done with an adjusted 93% of the 2011 values. The growth for 4Q 2011 relative to 4Q 2010 should also be adjusted on this basis.

The following tables show the unadjusted and adjusted growth rates. The adjustments apply to the bottom table and the columns highlighted.

Screen Shot 2013-02-04 at 2-4-7.19.18 PM

As in previous scorecards, I used the following color scheme to “grade” the performance. Continue reading “Apple's Calendar Fourth Quarter 2012 Growth Scorecard”

It's a wrap. Asymconf California

My thanks to all those who made Asymconf California the best Asymconf ever. We had over 200 attendees and, for the first time ever, 50 workshop participants and a panel session. The venue was spectacular: IBM’s historic Almaden Research Center and special thanks to Paul Brody of IBM for making it available.

Engagement was stronger than ever and I believe we moved the ball forward on a range of topics: The workshops helped solve some of the mysteries related to Amazon valuation and the main event looked at the limits of growth. The State of the Union took a look at the post-PC world and Apple’s inflection point. The panel session took on the future of TV and, including the audience, we had input from some of the most influential companies in the space.

We will scramble to make the proceedings (in the form of an iPad download) available as soon as possible.

Normal blogging and tweeting will now be resumed.

The job the iPhone is hired to do

In the latest quarterly report Apple changed how it reports product revenues. In previous quarters the iPhone and iPad were reported including accessory revenues while iPod accessories were reported under “Music” revenues.

“Under this new format revenue from iPhone, iPad, Mac and iPod sales is presented exclusive of related service and accessory revenue […] revenue from all Apple and third party accessory sales is presented as a single line item [Accessories.]”

Apple provided a document showing re-classified product summary data.  By measuring the difference between original revenue and re-stated revenue per product we can determine how much service and accessory revenue was being attached to each product.

I did this for two quarters as a sample:

Screen Shot 2013-01-24 at 1-24-2.16.14 PM


The analysis shows that the iPhone has been receiving about $15 of accessory attached value and the iPad about $25. Interesting trivia, but how is this insightful?

Consider the impact on this analysis of revenues/unit shipped: Continue reading “The job the iPhone is hired to do”

What's up with text messaging?

The following graphs show text messaging volumes, pricing and revenues for SMS in Spain.

Screen Shot 2013-01-18 at 1-18-2.40.39 PM

After peaking at the end of 2008 at about €450/quarter, revenues have fallen by 60% to about €171 million in the third quarter of 2012. These figures represent almost 100% operating profit for operators so the impact is felt directly in the bottom line. Continue reading “What's up with text messaging?”