For more analysis of Apple & the industry, join us at ACTIVE 2025.

Asymcar 13: Pilgrimages and Fundamental Evil

IMG_8829

On continental trips, diesel engines and autobahn speeds, pilgrimages to Porsche and BMW’s brand meccas.

How to understand the world through toy cars, from Matchbox to Hot Wheels, Siku, Majorette to Tomica.

On the business of car distribution, “channel stuffing” and the origins of state franchise regulation.

Reflections on Apple’s routing around now-defunct computer retail channels via its highly successful stores.

via Asymcar 13: Pilgrimages and Fundamental Evil | Asymcar.

Teenager stores

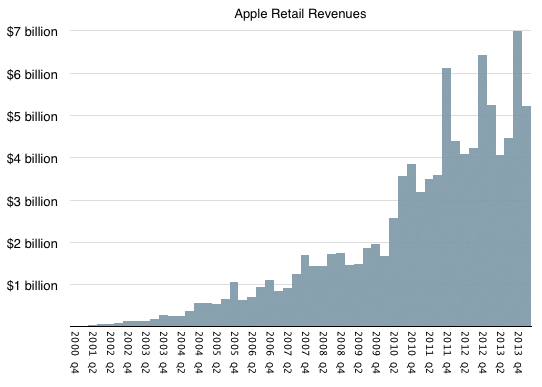
The Apple stores are now 13 years old.1 In the first full year of operation (2002) the stores generated revenue of $282 million. In the last full year (2013) the revenues were $20.228 billion. Quarterly sales during the last seven years are shown below:

Screen Shot 2014-05-20 at 5-20-11.16.21 AM

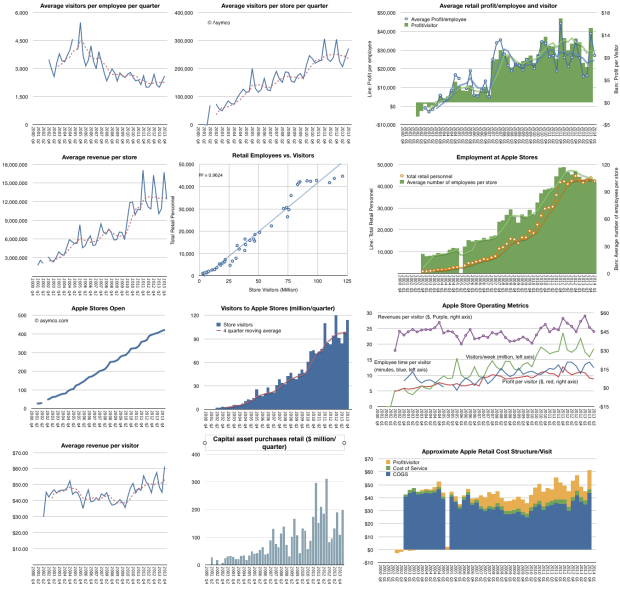
Additional details regarding average visitors per employee per quarter, average visitors per store per quarter, average retail profit/employee and visitor, average revenue per store, employment and visits correlation, employment per store and in total, stores open over time, visitors over time, average revenue per visitor, capital asset purchases and estimated cost structure per visit are shown below:

Screen Shot 2014-05-20 at 5-20-11.19.51 AM

The Apple store concept has reached teenage years and it seems a good time to renew their character.

  1. The first store at Tysons Corner in  McLean, VA opened on May 19 2001 []

Categorizing technologies

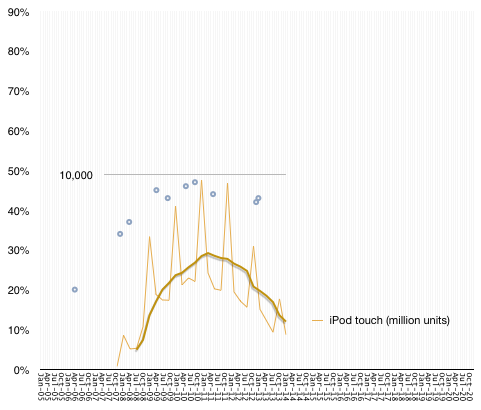
In the graph below the grey circles represent the US penetration (percentage of households which own) MP3 players.

Screen Shot 2014-05-19 at 5-19-7.55.22 PM

Superimposed on this sparse sample graph is a line showing the sales of iPod touch. This second graph has a different scale, shown with a gridline at 10,000, representing millions of units shipped by Apple. To smooth out seasonality I show the trailing four quarter average with a thick line.

The correlation is fairly evident. As iPod sales grew, penetration grew and “peak MP3” was recorded in September 2010 while peak sales occurred at the end of that year.

It’s not a stretch to say that iPod touch sales are causal to MP3 penetration, especially since the iPod has remained the market share leader in the segment for a long time (at least 70% share) and that the iPod touch is consistently half or more of the iPod.

The absence of data for penetration beyond 2012 is therefore not a problem. We can assume that MP3 devices have a finite lifespan and, if not replaced, the penetration will decline.

I modeled both the increase and decline with a diffusion curve as follows: Continue reading “Categorizing technologies”

Think local, act global

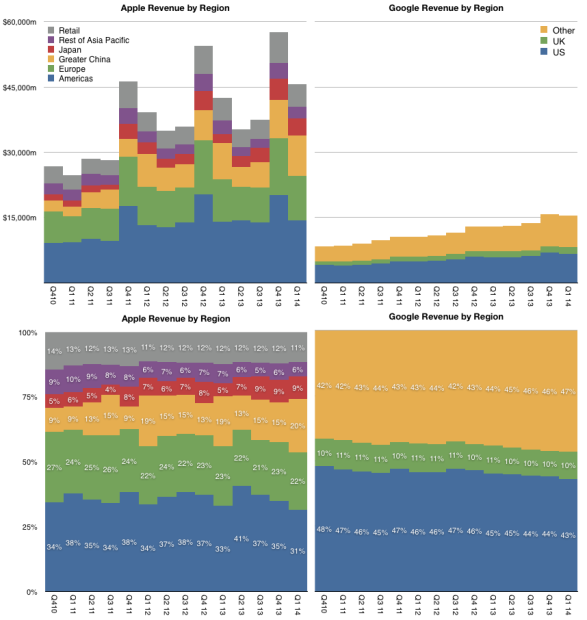
Three years ago Apple’s Greater China Q1 sales were $2.22 billion or 9% of total. This year they were $9.29 billion1 or 20% of total. Over this time frame the growth in China was about 320%. The second fastest growing reporting segment was Japan with growth of 187%. Europe was third with 70% and Americas fourth with 53.5%. Rest of Asia/Pacific had the smallest increase of only 4.1%.

A graph showing both the absolute and relative sales levels for the reporting regions is shown below.

Screen Shot 2014-05-19 at 5-19-11.35.17 AM

As overall sales have increased significantly, the revenues from the Americas and Retail combined (as most stores are in the US)2 went from 51% in Q1 2011 to  42% in Q1 2014. The 11 point increase in share for China can be thus seen as mostly at the expense of the US. As Americas did not decline more appropriate statement would be that China captured much of the growth of the last three years.

Note that I also included Google’s revenue split3 in the graph above. This is partly to calibrate Apple’s mix and to understand if the expansion outside the US is mirrored by other companies.

Google, in particular, is largely absent from the Chinese market and the only regional detail we have for their revenues is the US, UK and Other. That leaves an analysis of the dependency of each company on the US market.

Google’s US revenue percentage did drop from 47% to 43% but it’s worth noting that not only is the drop slower than Apple’s, the overall dependency of Google on the US for revenues is higher than Apple’s.

A surprising observation as Apple’s concentration of users, measured as market share for various products, is likely to be higher in the US than Google’s distribution of users.

Put another way, Google is broadly popular world-wide (except for search in China, Korea and Russia) but its customers and hence profitability are highly concentrated.

  1. Including China retail, revenues reached “almost $10 billion” []
  2. 60% of all Apple stores are in the US []
  3. Excludes discontinued operations, namely Motorola []

Measuring Not Getting the Cloud

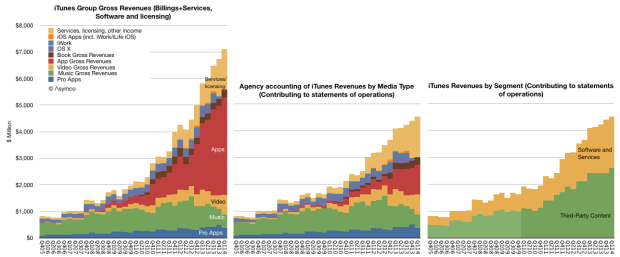
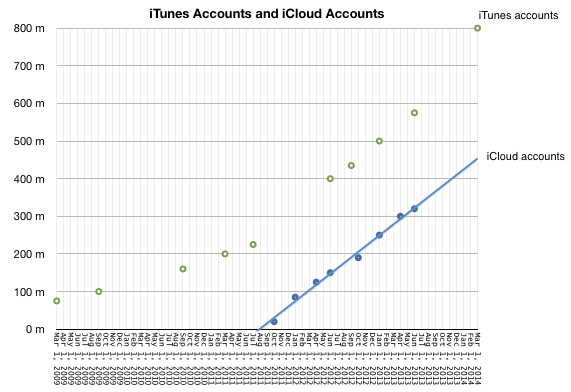
This is what “Not getting the Cloud” looks like:

Screen Shot 2014-05-09 at 5-9-3.30.03 PM

Screen Shot 2014-05-09 at 5-9-4.04.33 PM


“Not getting the cloud” means that in the last 12 months Apple obtained:

  • 800 million iTunes users and
  • an estimated 450 million iCloud users spending
  • $3 billion/yr for end-user services plus
  • $4.7 billion/yr for licensing and other income which includes
  • more than $1 billion/yr paid by Google for traffic through Apple devices and
  • $13 billion/yr in app transactions of which
  • $9 billion/yr was paid to developers and
  • $3.9 billion/yr was retained as operating budget and profit for the App Store. In addition,
  • $2.7 billion/yr in music download sales and
  • more than $1 billion/yr in Apple TV (aka Apple’s Kindle) and video sales and
  • $1 billion/yr in eBooks sold

In summary, iTunes, Software and Services has been growing between 30% and 40% for four years and is on its way to $30 billion/yr in transactions and sales for 2014.

This is what can be deduced from a reading of Apple’s financial statements of operations. If there are comparable details for companies which do get the cloud, I’ll be happy to tally the comparison so we can calibrate this failure.

How close is the UK to smartphone saturation?

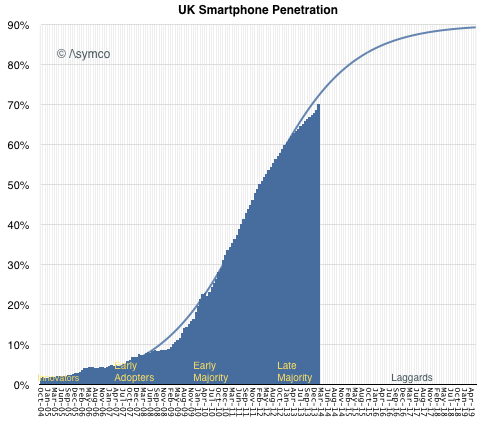
In How close to saturation is the smartphone I highlighted that the US is not nearly saturated at 68.8% penetration at the end of March. Since the US is not the highest penetrated, one may wonder whether other “developed” countries are far further along.

There is no data on all the countries in the world on the same resolution as that in the US, but thanks to Charles Arthur, Kantar shared data on the UK and we can have a clear trajectory for that country.

The most recent data for UK was as of February 2014 when penetration was 70%.

Screen Shot 2014-05-08 at 5-8-6.31.48 PM

In February the US figure was 68.2%, so the US is 1.8% behind in penetration. The equivalent picture of the US is below: Continue reading “How close is the UK to smartphone saturation?”

How close to saturation is the smartphone?

The US is not the market where penetration is highest. However, it is the largest market where we have reliable penetration data (from at least two sources) and the one where penetration is near the top of the range.

The graph showing the US ranked against others as of a year ago is here. The US was cited at 56.4% at the time. I keep track of comScore’s data and it showed 58.2% at the end of March and 55.3% at the end of January, making the figure very believable.

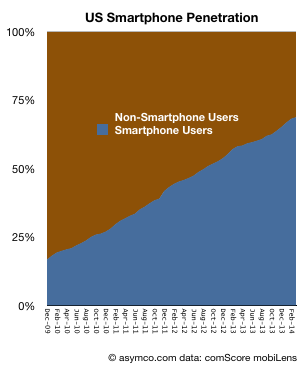
The most recent data from comScore shows penetration at 68.8%. In order to understand what the limits of that growth could be it’s important to see the longer-term pattern. It would show whether there is a clear point of inflection and thus a predictable “saturation” around an asymptotic value.

The following graph shows the percentage of smartphone users/non-users since late 2009.

Screen Shot 2014-05-08 at 5-8-6.13.29 PM

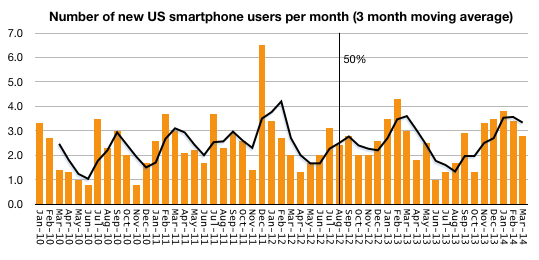
The following graph shows the rate at which users are being added to the smartphone ranks (measured as new users per month.)

Screen Shot 2014-05-08 at 5-8-6.14.01 PM


To summarize, the conversion of users from non-smart to smartphone usage is fairly constant. The March ’14 period saw 2.8 million new-to-smartphone users. the March ’13 period saw 3.0 million, the March ’12 period saw 2.0 million and March ’11 saw 3.0 million. There is no discernible slowing of adoption.

Note that I added a trailing three period average in new users which fluctuates somewhat predictably due to seasonality. Finally, note that the figure of 50% penetration was reached almost two years ago and no noticeable change of adoption has happened since. Cellular phone ownership in the US is still rising (though very slowly) and it now about 90%.

The only conclusion is that even at the current 68.8% penetration, we are not anywhere near “saturation” of smartphone users in the US, and the US is a leader among “developed markets” so there is little to suggest that saturation has happened anywhere with significant populations.

Monthly Apple Users

In the postmodern computing world that we live in, the measure of success isn’t revenue or profit or units sold but the number of users that an ecosystem can attract. Therefore the monthly active user (MAU) unit of performance seems to be in vogue right now. E.g.:

  • Facebook claims Messenger has more than 200 million MAUs
  • WhatsApp has 500 million MAUs, 48 million of whom are in India
  • Line last month announced that it had 400 million users (active or not)
  • WeChat claimed 355 million MAUs
  • Viber claims 105 million MAUs

Startups are aggregating these millions of MAUs in order to obtain valuations for raising capital1 and the faster the growth in MAUs the more “successful” the company is considered.

When companies are acquired it’s common to take the transaction value and divide it by MAUs to get an idea of “what an user is worth”. This is because there are no revenues to measure and MAUs are taken as a proxy. However, the process by which a MAU becomes a dollar of profit is, to put it kindly, circuitous.

For most (all?) it’s not yet clear how it happens especially since not all MAUs are created equal and MAU loyalties can change rapidly and if we added all the projected revenues each MAU will contribute to each app on her device we might reach some absurdity. In actuality, today, for the companies listed above, there are no revenues at all directly from their services.

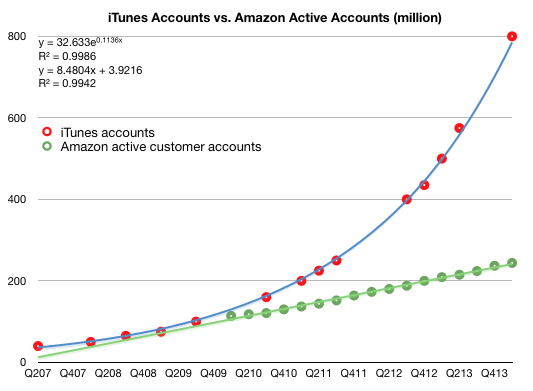
In violation of this convention, there are some companies which manage to obtain revenues from their users. Two such are Apple and Amazon.  In the last quarter Apple reported having 800 million iTunes accounts.2  These aren’t MAUs since the activity level is not noted, but we do know how much is spent on iTunes and services. In addition, Amazon cites 244 million active customer accounts  representing accounts which generated purchases within the last 12 months.

This allows us to compare Apple and Amazon in terms of accounts, revenue per account, and, via some analysis, even profitability per account.

The following graphs tell this story. First, the total number of accounts:
Screen Shot 2014-04-29 at 4-29-11.25.29 AM

Note that I added trend lines to both graphs and their formulas.

The following are the revenue per account for iTunes (further broken into estimated iTunes segment revenues per account.) and for Amazon. Note that the vertical scales are different. Continue reading “Monthly Apple Users”

  1. It’s been said that it’s difficult to get funded with only 10 million MAUs []
  2. adding, for some unknown reason, that most of them have credit cards. []

Innovation Talk: Overuse of word innovation has blurred its true meaning – Business News | Latest News Stories | The Irish Times – Mon, Apr 28, 2014

“Innovation” is one of those words that, through casual overuse, has come to signify a wide array of distinct concepts – in some sense, the word is literally losing definition, like an out-of-focus photograph that manages to become blurrier every time you look at it.

These days, anytime anyone does something vaguely new, or a new feature gets added to some gadget or other, the innovation word gets flung about. Indeed, the word is used with the same reckless abandon as those other favourites of jargon-loving MBA types, “solutions” and “disruption”, rendering it increasingly meaningless.

More from Davin O’Dwyer: Innovation Talk: Overuse of word innovation has blurred its true meaning – Business News | Latest News Stories | The Irish Times – Mon, Apr 28, 2014.