For more analysis of Apple & the industry, join us at ACTIVE 2025.

The PC market overview for Q1

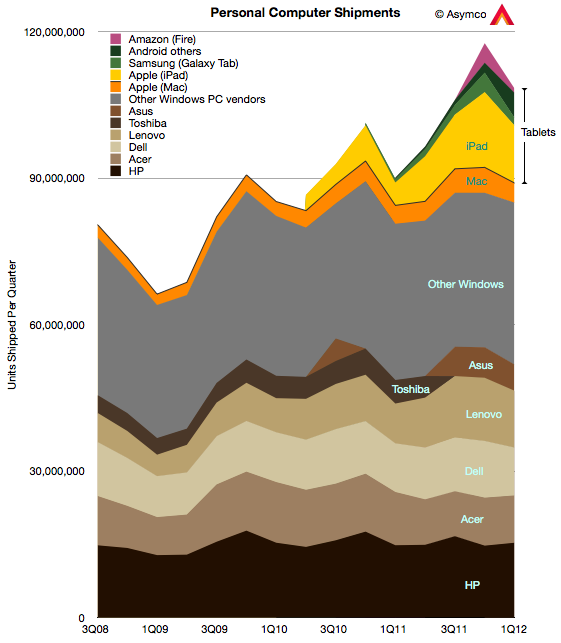
In terms of units Windows-based computers made up 78% of all PCs sold in Q1. That was an increase from the 74% in the previous quarter but a decline from 90% a year ago. OS X based computers were about 3.7%, a decline in share both q/q and y/y, something the company attributed to a transition quarter.

The following chart shows the composition of vendor volumes with tablet and traditional form factor computers included:

iOS computers (i.e iPad) were 11% of the market, declining from 13% last quarter but increasing from Q1 ’11’s 4.2% share. Apple reported that the iPad was not at supply/demand balance and thus could have sold more units. Continue reading “The PC market overview for Q1”

Up to eleven

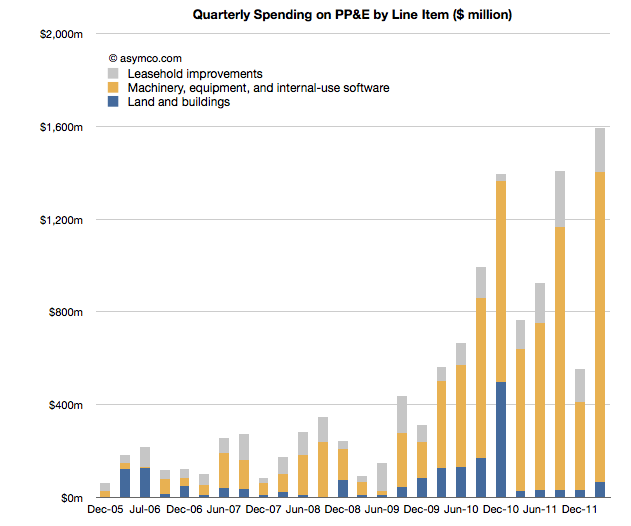
During my talk at the first Apple Investor Conference in January I said that I would pay very close attention to the Machinery, equipment and internal use software line item from its PP&E during the next quarterly report (it appears on Page 13 in the latest report).

The reason I consider this important is because capital spending has provided reliable foreshadowing of iOS device production. This is itself because Apple invests in the equipment used in the manufacturing processes for its devices. The more spending on equipment, the more production capacity is brought to bear and the more units are produced. Since iOS devices tend to be supply constrained, the more units are produced then the more are sold.

The first quarter of the fiscal year saw a very small increase in CapEx which caused me to “backload” spending later in the year. By watching this spending, we can assess approximately when and for which products is investment allocated. If the spending happens early then we can anticipate an early update to the iPhone. If it happens late then we can anticipate a late release. So has the ramp-up begun as of the second quarter (first calendar quarter)?

The following chart begins to give us the answer. It tells the story of spending by tracking the change in asset values:

Stripping out the Machinery and Equipment portion (in yellow above) and overlaying the following quarter’s iOS shipments yield the following composite graph: Continue reading “Up to eleven”

Interview with Bruno Ferrari of Exame magazine Brazil

My thanks to Bruno Ferrari of Exame magazine Brazil for asking the following questions. My answers were written two weeks ago on April 2nd.

Based on financial data of the first fiscal quarter, it is possible to confirm that 2012 will be the best year in Apple’s history?

Actually, it’s possible to confirm without looking at first quarter data. Every business line Apple has except the iPod is growing and is likely to keep growing during this year. That means that sales will increase over 2011, which was Apple’s biggest year. You can see historic sales growth data here:

 What are your predictions for the second fiscal quarter?

I published my predictions here.

The iPhone number seems to be higher than consensus. It’s aggressive but I’m basing my opinion on the launch of the iPhone 4S in China and the Chinese New Year and new carrier agreement there. Also the iPad will do quite well.

Do you think Apple will hold the iPhone 5 launch to September in order to open 2013 with an extraordinary result?

Continue reading “Interview with Bruno Ferrari of Exame magazine Brazil”

An interview with Chris Brennan for MacUser magazine UK

Chris Brennan asked a few important questions regarding potential saturation of the iPhone market.

Is the iPhone anywhere near saturation? Can Apple continue to shift iPhones in ever increasing numbers or is a sales plateau realistically on the horizon?

The market for mobile phones is approximately 5.5 billion connections, perhaps 5 billion users. The iPhone has approximately 300 million installed base. I consider a base of 1 billion users to be a minimum for continuing participation in this market long term. Licensed platforms will reach this in no more than two years. I don’t know what Apple’s ambitions are but if they don’t triple their base I don’t see a strong future for the company in mobile phones. In order to triple the base the company will need to sell substantially more than an additional 700 million iPhones. The retirement rate can be as high as 50% of installed base. Apple will need to sell at least 1 billion iPhones in the next few years. Seen another way, Apple has a market share of about 9% on a quarterly basis. This needs a lot of improvement. Chinese vendors are not standing still.

Can the Mac also continue to outperform the rest of the PC market for long? Continue reading “An interview with Chris Brennan for MacUser magazine UK”

An interview with Kenney Ho of The Chosun Daily of Korea

Kenney Ho, a staff reporter from Korean newspaper The Chosunilbo (The Chosun Daily) sent me a set of delightful questions.

According to Kenney, The Chosunilbo “has a history of 90 years, has been the most dominant, and influential paper of all time in Korea. It is the No.1 newspaper company in Korea with more than 1.8 million circulation, firmly holding the largest market possession. The paper is recognized Asianwide, where there are many readers in Japan and China.”

-You said “All mobile device vendors experiencing losses are not likely to really recover”. Even though, it wouldn’t mean that the employees, executives of Nokia has completely nothing in hands for recovery. If you are the CEO of Nokia right now, What are your steps to make Nokia recover its deficits?

My statement was based on the historic data which shows that 14 phone vendors have either exited the business or lost their independence during the last decade. No vendor that has reached a period of prolonged loss making has recovered. These are just observations and it’s possible that Nokia may be the first to recover. However, going by the patterns of the past, it would be very unlikely. When I thought about the reasons why companies have not been able to recover I came to the second observation about the way phones are sold. Once a brand reaches a point where it’s considered “risky” for distributors and operators to range they tend to defer purchases which leads to a spiral of continuing losses and more damage to the brand. The market amplifies “distress” and recovery becomes impossible.

If I were the CEO of Nokia I would set course for turning the company into a new business. I would approach the market asymmetrically and not try to compete directly with the other vendors. I would look toward services, platforms and software solutions and de-emphasize hardware.

-Many experts say that because Nokia dominated phone making industry in the 2000s, they maintained a corporate culture of complacency, which led them to decline. Do you agree with this? If you agree, Can you point out the examples of Nokia’s complacency? Continue reading “An interview with Kenney Ho of The Chosun Daily of Korea”

Calculating Google's contribution to iPhone profitability

In the iPhone cost structure analysis I showed how revenues and costs for iPhone are probably allocated. The revenue per iPhone was shown to include $29 for revenue items “above” the price of the phone to the channel. This total includes Apple’s own iPhone accessory sales plus revenue from licensing the “Made for iPhone” trademark to third party accessory makers. Apple also receives some revenues from cloud services. But, pertinent to our recent discussions on the Android business model, Apple also receives revenues from Google.

Wouldn’t it be nice to know how much? Here’s a way we can estimate it. Continue reading “Calculating Google's contribution to iPhone profitability”

Android’s contribution to Google

Yesterday I presented the estimated Android income statement vis-à-vis Apple’s income statement. In this post I’ll compare Android as a part of Google’s overall business.

Recall that Google has already been compared in terms of overall revenue, growth and profitability to Apple and Microsoft here.  The argument can be made that mobility has not yet had a measurable impact on Google (certainly not noteworthy enough to be reported by management).

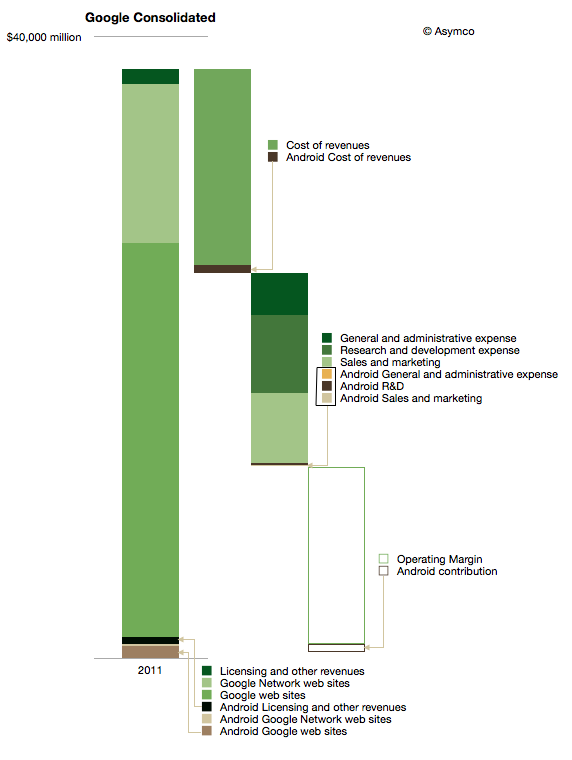
The impact on Google of Android can be shown in the following diagram:

I used color coding to identify non-Android (Green) and Android (Brown) segments of the business. Overall, Android could amount to about 3.5% of total Google revenues and about 5% of operating earnings. Continue reading “Android’s contribution to Google”

The Critical Path: The First Year » What I've learned so far on Kickstarter

One week into this project and the response has been phenomenal. We are at nearly 500% funded. There are 414 backers so far and the average pledge is nearly $34. This means that the vast majority of people (328 so far) opted for the $35 pledge. Many pledged even more than $35.

Perhaps it’s only symbolic but the interest in the hard copy version was something I did not expect. It’s gratifying that people would prefer to have a physical representation of the work. It also means that I have to think carefully about the production of a good quality paper book.

The abundance of support allows me to invest in design, editing and perhaps illustration as well as the text. I will also have to do a lot of signing.

Thanks again to all who have contributed. I’m completely humbled by the level of support and can only promise to keep doing that which has been so resolutely defended by you all.

via The Critical Path: The First Year by Horace Dediu » What I’ve learned so far — Kickstarter.

Android Revenues in Perspective

Data is useful only when put in perspective. Yesterday’s post on the Android Income Statement showed how sales and revenues are captured and how costs are paid for that revenue. The data was shown for the entire calendar year 2011 and the maximum value in the vertical axis was $1.5 billion.

Google has also reported that their revenue “run rate” is now in excess of $2.5 billion so there is significant growth, as would be expected from an exponentially increasing user base.

However, it’s important to place this growth in perspective, both in absolute and in relative terms.

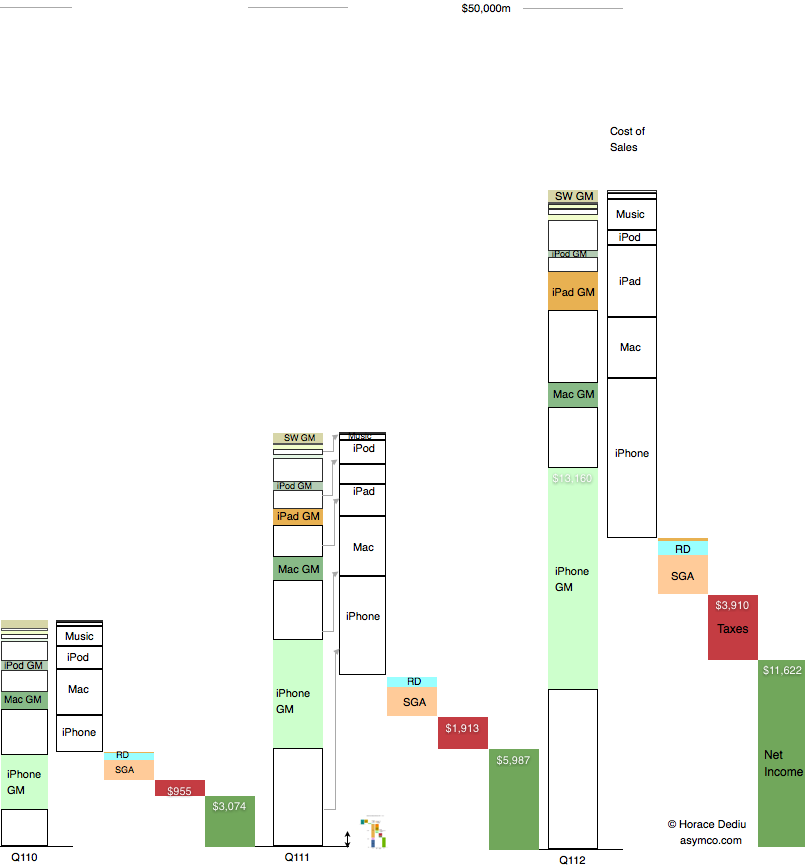
Below is a diagram showing Apple’s revenues for the first calendar quarters of 2010, 2011 and 2012. Each product group (iPhone, Mac, iPad and iPod) is shown separately with estimated gross margins (GM). Operational costs, taxes and net income are also shown.

Consistent with previous versions of this data are the color schemes where white areas represent costs of goods sold.

I also placed a scaled version of the Android Income statement next to the first quarter 2011 revenue bar for Apple. The scale is maintained where $1 billion is represented by the double-ended arrow line.[1] Continue reading “Android Revenues in Perspective”