The Frontiers of Platform Adoption

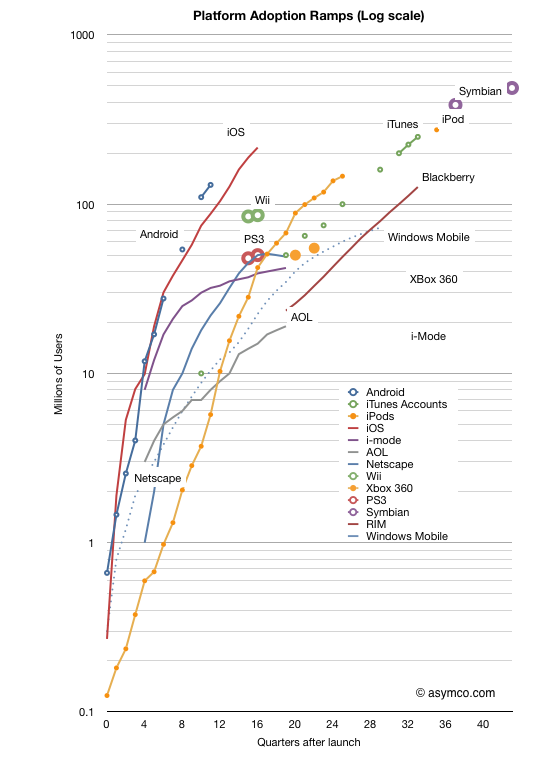
In the last two weeks we received two more data points which allow an update to the “race to a billion” platform growth trajectories. Android reached 130 million active users and iOS reached 200 million.

The updated picture looks like this:

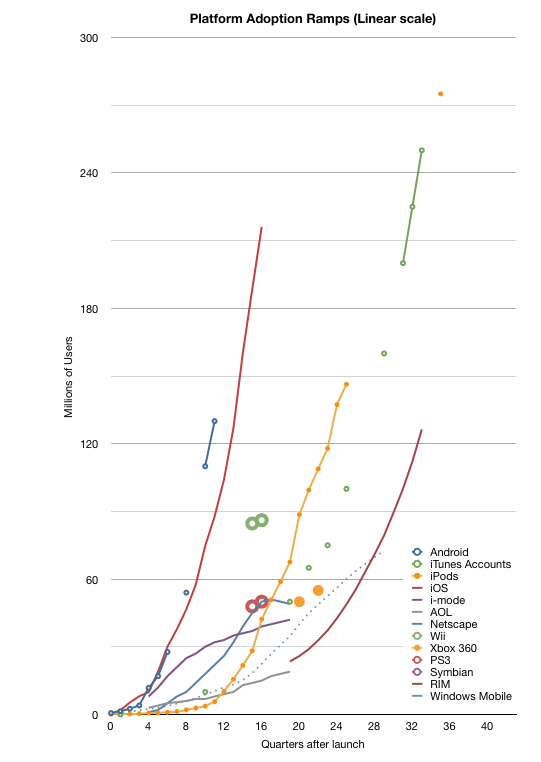
Note again that this is a log scale graph. Every major horizontal gridline is an order of magnitude (10x) larger than the one below. It’s a busy graph. The linear version follows:

For the detail-minded, it makes for some interesting comparisons, but I want to create a more compelling visualization. One where each platform can be judged for potential and impact at a glance.

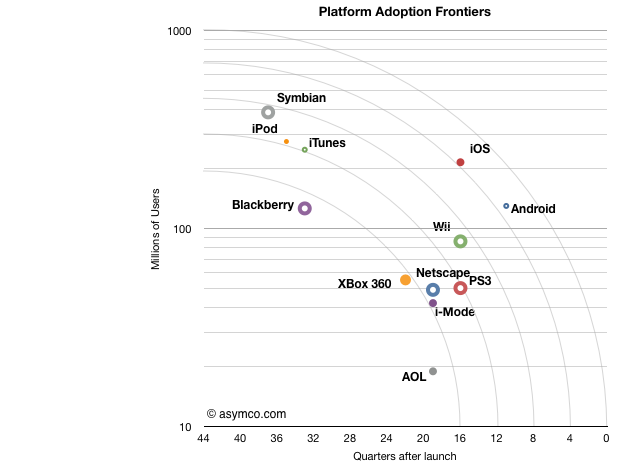
To that end I came up with something I call the platform “adoption frontier” view. Based loosely on the Pareto efficiency concept the chart is reduced to show the latest known figure of (users,time) and overlay concentric arcs centered on 10 million/10 years and radii of unit years (x-axis).

Note that the time axis is reversed from the chart above. This was to allow the best performers to be shown at the upper-right of the chart.

The way to read this is as follows:

  • Each platform is represented by a point which shows its currently known peak in users and time to reach that number of users.[1]
  • The arcs (frontiers) represent possible performance classes.
  • The lowest frontier spans “four years to reach 10 million” to “10 years to reach 200 million”. The highest frontier spans “<1 year to reach 10 million users” to “10 years to reach 1 billion users”. Each frontier can be read in a similar way.
  • The main assumption is that a platform can reach more users but it takes time. Better performance is when a platform moves toward a frontier further from the origin.[2]
  • I chose the limits of the chart specifically: 10 years is roughly the limit of most platforms[3] in the current cycle time of technology disruption; One billion users is an upper bound set by Windows.

One thing you can read from the chart is to say that “from a growth point of view, Blackberry is weaker than any of the other platforms.” Sitting below the lowest frontier with fewer users than Android which has been in the market for less than a third of the time it seems to be less impressive. It is, however, in a similar band of growth as Xbox 360, which, by some measures, is a success story. So the performance standard is relative.

One can also see the rough equivalence in growth between iPod and Symbian, both having crossed the second frontier. But iOS and Android are in a different league. They sit alone beyond the fourth frontier. The fifth frontier is the “billion user in a decade” potential and it seems within reach for both.

What this view also offers is an answer to the question of competitiveness. Although platforms can co-exist and don’t necessarily overlap, the question of becoming overwhelmed with “good enough” by widespread low end alternatives looms for the specialized platforms. For example, game consoles look very vulnerable because they simply do not have the potential to cross high frontiers and orders of magnitude of casual gamers (with potential TV connected devices) might orphan the consoles.

I’ve also included some platforms that have peaked and faded (AOL and i-Mode and Netscape) as a warning. The frontiers illustrate of how hard it is to reach the upper limits of growth. Each level is exponentially more difficult than the last and achieving it with paying customers is a remarkable story of value creation.

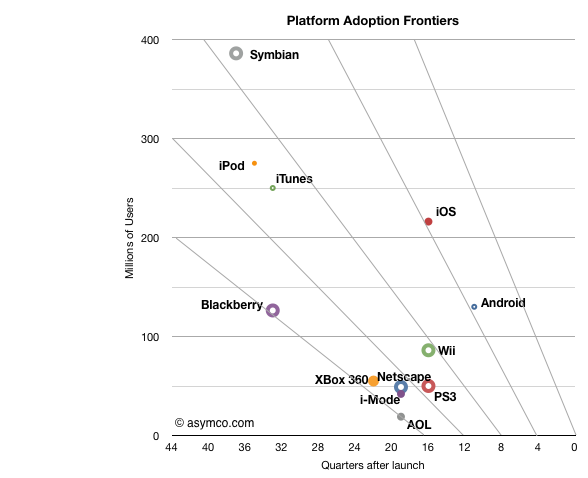
[UPDATE]

I add below the frontier chart with a linear vertical axis. Note that the frontier lines are not equivalent to the frontier arcs in terms of coverage.

Note:

  1. The data I have is for platforms where users have to pay something to participate. I exclude platforms where users are the only merchandise being sold (i.e. social networks or email provision).
  2. I only include the initial ramps not upgrades. Windows is anomalous because it is so old. During its first decade (1985 to 1995) it reached over 17 million users but placing it on this chart does not do it justice given the growth occurred in its second decade.
  3. See Symbian and Windows Mobile. However again, Windows which is nearly 30 years old, is an exception.


Is the tablet computer a new PC or post-PC?

Steve Ballmer stated and Andy Lees confirmed that Microsoft views iPad and other tablets as “just PCs”. From a market measurement point of view Canalys agrees. IDC and Gartner don’t, calling the new devices “media tablets.”

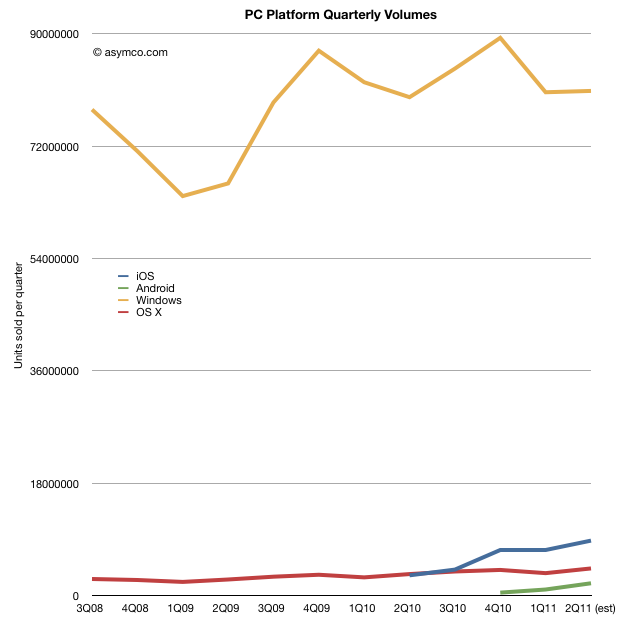
Before deciding whether tablets belong with PCs in market metrics, it would be interesting to look at what the data shows. When seen as a combined market, the focus should be on platforms. The following chart shows the four main PC+tablet platform volumes since late 2008 [1].

The second chart shows the same data as share of total market: Continue reading “Is the tablet computer a new PC or post-PC?”

iTunes app total downloads (finally) overtook song downloads

It was only a few weeks ago (at WWDC) that we had an update on the app store growth rates. The data was presented here.

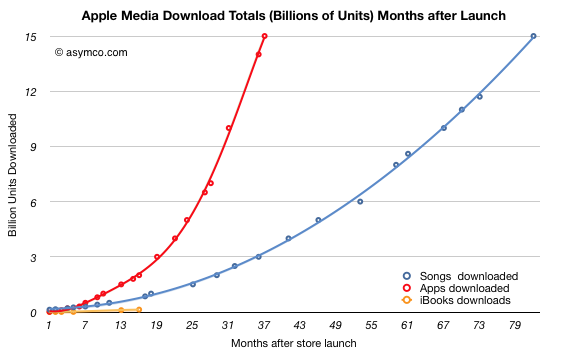
One of the data points from the event was that iTunes hit 15 billion song downloads. Last week we heard that iTunes also hit 15 billion app downloads.

The milestones were reached within less than a month so it’s a fairly safe assumption that apps have overtaken songs. I had originally guessed that the cross-over would take place at 13 billion at the end of 2010.

The actual performance is shown below (total downloads indexed to same starting date):

The 15 billion app threshold was passed within exactly three years while the 15 billion song threshold was passed in six years and 10 months. Shown on the actual time scale, the chart looks as follows: Continue reading “iTunes app total downloads (finally) overtook song downloads”

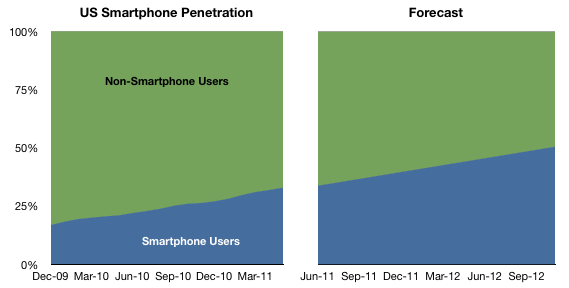
Switching rates for US smartphone users suggest 50% penetration by August 2012

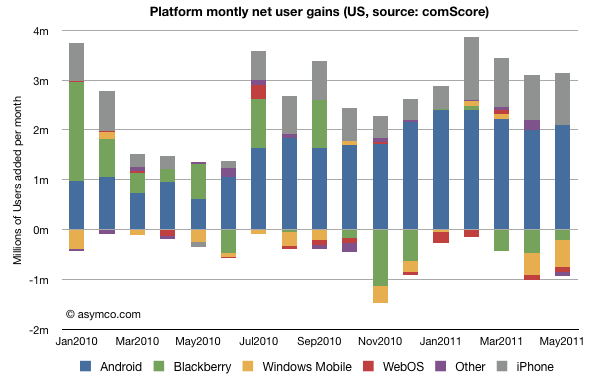
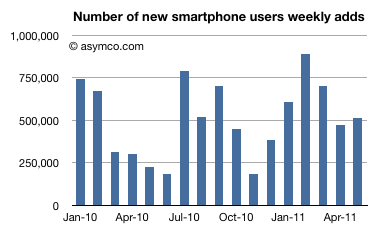
The latest comScore MobiLens is out and it allows an update to the picture of the US phone using population. Through the three month period ending May 2011, smartphones were in use by 76.8 million or about one in three US phone users. Here are some other highlights:

  • A total of 513k users switched into using a smartphone every week during the period, a rate of switching consistent with the last 17 periods (average of 510k/wk).
  • Penetration of smartphones increased by 940 basis points, slightly higher than the 900 bp increase in the last period but consistent with average.
  • Using a four-period trailing average and linear extrapolation, 50% penetration will be reached by August 2012. “Summer 2012” seems a safe bet as that target has not changed much.

I’ve updated the countdown counter (Phone Tipping point at top of right column on this page) to reflect the new date.

The following charts show the penetration and switching rates.


The Post-PC era will be a multi-platform era

Windows Phone Marketplace has reached 25,000 apps. That’s an impressive figure given that so few devices have actually been sold. Compared with Android which is activating half a million devices per day, Windows Phone seems like a rounding error. According to Gartner, 3.6 million smartphones using a Microsoft mobile OS were sold in the first quarter of 2011, of which 1.6 million were Windows Phone 7. That implies a daily activation rate of 17,500 per day or one WP device for every 28 Android devices.

And yet the number of apps on Windows Phone is more than 10% of the number of Android apps and Android Apps are about half of iPhone apps. As far as Windows Phone is concerned, apps are being added faster than users. Why is this?

If we take the point of view that mobile platforms behave like the computing platforms of years gone by (i.e. Windows vs. Mac) then this is inexplicable. Developers should not be bothering with a distant third. This would be like betting on the Amiga in the era of Windows.

But we’re not in the PC era any more. That era had very high software development costs. It had very difficult software distribution channels (retail box sales typically) and very few categories of software with high price points. It was also dominated by institutional buyers which did not give quarter to small vendors. It was also a time when there were orders of magnitude fewer users and even fewer buyers.

The post-PC era is characterized by an explosion of ideas and application of new talent to software. It’s an era of immediate gratification and painless, one click distribution. App production is a cottage industry not something entrusted to only a few experts or those who can raise venture capital. It allows the small to distribute widely and get a shot at stardom. It has been (thankfully) avoided by enterprise buyers. The result is an explosion of apps: well over half a million new apps have been built in three years on three platforms that did not exist three years ago.

So the very reasons which are driving developers to spread their bets across all and any new platforms should indicate the potential for new platforms and the sustainability of small platforms. The thesis that one dominant platform wins the mobile “war” is naive. The post-PC era will be a multi-platform era. Developers already understand this. Platform vendors know this. It’s time to unlearn the lessons of the PC era.

The Critical Path #3: It's Good to Be King – 5by5

The Critical Path #3: It’s Good to Be King – 5by5.

July 3, 2011 at 6:00pm

Horace Dediu and Dan Benjamin discuss the power of cash to control supply chains in the post-PC era and how Apple is challenging conventional wisdom about its value to shareholders.

RUNTIME: 57:19

The Critical Path is also available on iTunes. Don’t miss a show, subscribe.

The Android (in)adequacy: How to tell if a platform is good enough

About 10 years ago I met an advertising executive in New York who explained the difficulty of advertising a new brand of deodorant to consumers. “Most people never change their deodorant,” I remember him saying. “They pick one brand when they are young, and stick with it for a long, long time. If it works, why switch?”

The same theory can be applied to customers who are making the switch to smartphones today. Once they have picked a type of phone, whether it’s Apple iOS, Google Android or something else, it’s difficult, and often expensive, to switch. Consumers become comfortable with the interface and design of the phone and the apps they have purchased on that platform. If it works, why switch?

Many Smartphone Customers Are Still Up for Grabs – NYTimes.com

This quote says a lot. The notion that customers remain captive to a platform is well understood. After all, it seems impossible to get people to switch out of Windows (or Mac or iPod). Platform vendors are aware of this as the land grab for users seems to be running at full pitch.

However, there is a critical condition described in the quote above: “If it works, why switch?”  The condition which keeps users loyal is that the product they chose is good enough–i.e. “it works.” That’s a symptom of over-service and commoditization. If a product, like deodorant, is good enough you won’t be tempted to move to another brand even if it’s marginally better since the new brand has switching costs in the form of uncertainties (“Will it be as good? What if I don’t like the smell? etc.) People are inherently conservative and you can’t compete with comfort and familiarity by launching a marginally better product.

So with that in mind, why is it that millions are switching mobile platforms? Continue reading “The Android (in)adequacy: How to tell if a platform is good enough”

How much is an iOS user worth to Apple? About $150. Every year.

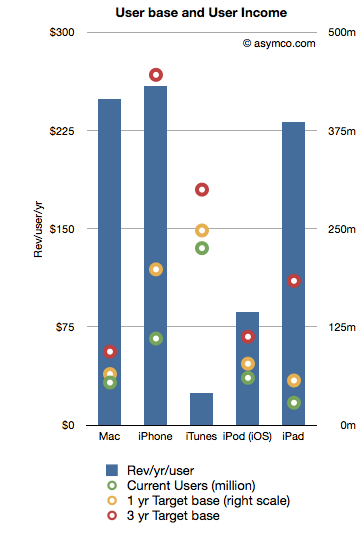
During the last WWDC Apple revealed that there were 54 million active Mac users. If we look at the history of the product we can see that it took about 5.5 years to sell 54 million Macs. If we assume therefore that the average lifetime of a Mac is 5.5 years and knowing that Mac sales generated revenues of about $73.8 billion then we can estimate the average revenues/year/mac user: $250.

Repeating the exercise with 180 million current iOS users who purchased about 200 million iOS devices and assuming a life span of 3.5 years gives the average revenue/year/iOS user of about $150.

These are recurring figures. If we assume these users are loyal then they will likely spend this amount indefinitely and each additional user will be worth a similar amount.

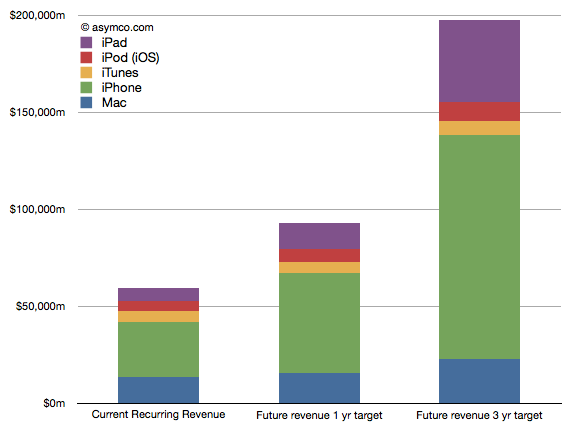
So, for example, if we assume that the number of Mac users reaches 100 million then we can also assume that they will generate about $25 billion/yr in recurring revenues.

Likewise, if we extrapolate growth of iOS to 500 million users then we can assume they will generate $74 billion/yr in recurring revenues.

Adding these together gives a potential recurring income level of $95 billion/yr for installed base alone (excluding iPods, Peripherals, iTunes apps/songs, and Software sales.) Today that figure is about $40 billion/yr. [1]

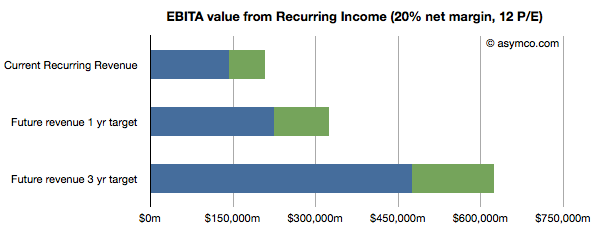
Interesting valuation exercises can follow. [2] It would also be interesting to perform a similar analysis for other vendors/platforms.

Notes:

  1. Note that actual sales are considerably higher than this figure as new customers are added. These figures should be considered “baseline” sales.
  2. Thanks to a kind reader for suggesting this line of analysis.