“The iPad is far more subtle, in fact it really is like a drawing pad. They will sell by the million. It will change the way we look at everything from reading newspapers to the drawing pad.
“It can be anything you want it to be. This is the nearest we have got to seeing what I would call a universal machine.
In-car iPad mounting
Fantastic…
Plus ça change, plus c'est la même chose
And so this morning, the handset maker announced another sweeping overhaul of its management structure, its second reorganization in less than a year.
via Nokia Reorgs Evidently Biannual | John Paczkowski | Digital Daily | AllThingsD.
Apple's Valuation Struggle
I don’t know how many times I can re-write this story but here goes another try.
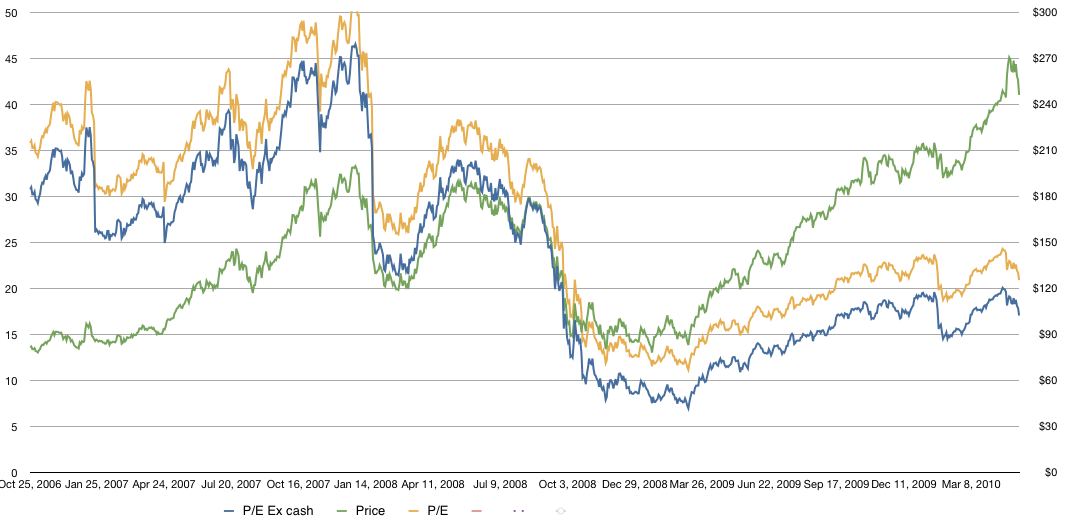
In the graph below I show Apple’s historic share price overlaid Apple’s P/E (with and without cash).
The share price is the line in green with the scale on the right and the P/E (trailing twelve months ex-cash) is shown in blue with the scale on the left. The P/E including cash (which is what is usually cited) is shown in yellow.
As the graph shows, while the stock has risen, the P/E has fallen. This is due to earnings accelerating faster than the stock price. As valuation is usually correlated with growth, it stands to reason that Apple continues to be discounted as a growth stock.
Visualizing iPhone vs Android Shares
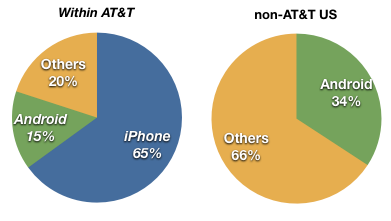
Following up on my last post on how misleading US-only share comparisons can be, I decided to draw charts to visualize the comparison.
As Android and iPhone compete in various ways, it’s hard to see which is the preferred choice given a direct comparison. In other words, iPhone and Android devices rarely are placed next to each other with similar terms.
Take the US market for example. The overall data from NPD suggests that last quarter Android reached 28% share vs. 21% for iPhone. Many of those Android devices were new to market or at least newer than the iPhone which in Q1 was coming to the end of its product cycle. Second, pricing for Android devices seems to have been quite aggressive with buy one get one free sales. But I won’t dwell on tactics now; what I do want to note are the differences in share between AT&T users and non-AT&T.
 Note that within AT&T, iPhone outsells Android over 4 to 1. iPhone also outsells “others” (mainly RIM) more than 3 to 1. However, outside AT&T, where the iPhone is not available, Android does not outsell “others”.
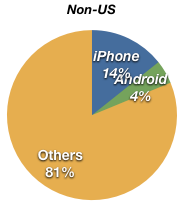
If we exclude the US altogether, we also see that Android does not have a great distribution.
 Outside the US, the iPhone also outsells Android nearly 4 to 1, but it has a way to go before challenging Symbian which makes up the bulk of “Others”.
So in markets where Android is head-to-head with the iPhone (AT&T and non-US markets), iPhone’s lead is quite high (still). The possibility still exists that Android will overtake iPhone given the broad licensing and distribution, but it’s not necessarily a given. And in any case, iPhone is not the market share leader today and that leadership does not seem to be their objective (note the pricing).
The bigger question is what will happen to RIM and Symbian as Android grows.
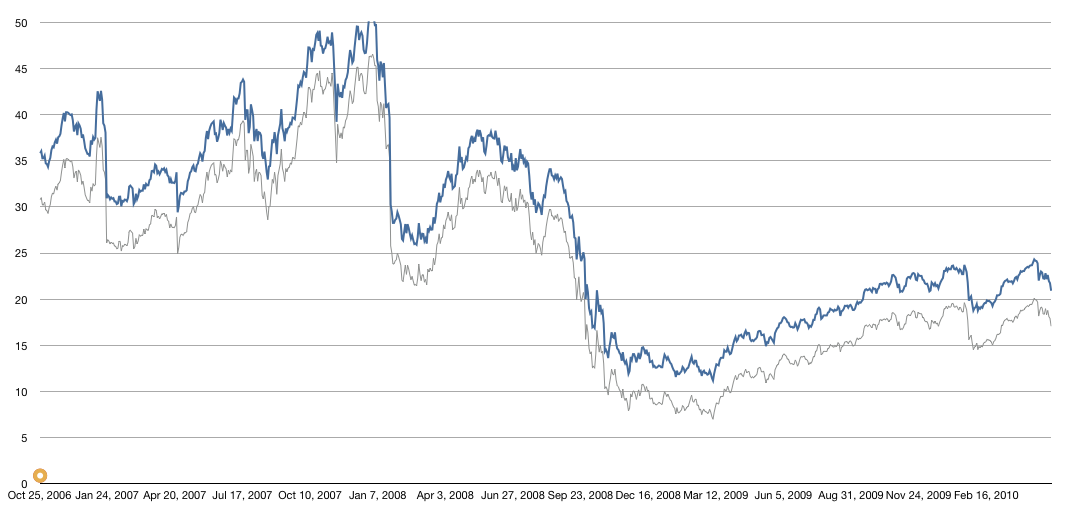
Apple P/E Briefly Drops to 20
NPD: iPhone is 65 percent of AT&T's smartphone volume
Much ink is being spilled over Android outselling the iPhone in the US in Q1. Here’s what NPD survey data shows:
- Q1 units for Android reached 28% vs. iPhone at 21%.
- AT&T stated that they activated 2.7 million iPhones. That is 31% of all iPhones sold by Apple. Assuming NPD data is accurate, we can conclude that Android shipped 3.6 million units in the US or 65% of their total.
- In a previous posting (Global smart phone OS shares « Asymco) I estimated, based on Canalys estimates, that global Android share reached 10% last quarter or about 5.5 million.
- We can compute that Android captured only 4% of smartphone share outside the US while Apple obtained 14% share.
- You can also observe that iPhone’s US share increased y/y while every other platform except Android dropped (implying that Android took share from everybody but Apple.)
- NPD claims AT&T accounted for 32% of the smartphone market, and even though AT&T carried both Android and WinMo and Blackberry devices, 21 out of every 32 phones or 65% of AT&T’s volume were iPhones.
- We can conclude that Android captured 34% of the non-AT&T US smartphone market.
The table below combines the NPD, AT&T, and Canalys data to show units for iPhone and Android in the US, Global and non-US regions.

One can only wonder what would happen if iPhone would be available non-exclusively. Would iPhone achieve greater than 60% share as it did on AT&T? Certainly that’s what happened in France.
Survey: Consumers are replacing other computers with iPad
According to a new survey, 44% of iPad purchasers say they won’t be buying a notebook because of the device.
via Survey: Consumers are replacing other computers with iPad.
Count me in with those 44%.
Apple's WWDC event sold out in 8 days
iPads sell out in days, WWDC sells out in days, can Apple deal with demand?
It might be a nice problem to have, but one gets a sense that Apple has growing pains.
Why Nokia's board backed the CEO in a stay-the-course strategy
Nokia chairman Jorma Ollila said the company’s management is fully supported by the board
via Nokia board backs CEO, new device strategy | Electronista.
In my assessment of Nokia’s competitive response to the mobile computing disruption I had anticipated an effective re-organziation to begin in 2013, so it came as no surprise that a stay-the-course plan is still being supported at this stage.
This is to be expected because a disruption, by definition, discourages a symmetric response from the incumbents. Indeed, management would face serious scrutiny and probable dismissal if they did address the challenge head on. A symmetric response would begin with a declaration that the entire asset base of the company is a sunk cost to be written off. That would include its products, distribution network, development processes, resources and priorities. Such a response can only come about from a near-death experience.
You can certainly see the dilemma: It would be absurd for management to declare that their top rank position in the mobile phone market is an undesirable situation to be in. It would be even more absurd if they suggested scrapping their entire world-leading volume business to re-focus on a new business–doing basically what Motorola has done when they were facing oblivion. The chances are, however, that this is precisely what needs to be done, and the sooner the better.
So being sensible is the path always chosen. Being bat-shit crazy is not an endorsable strategy.
Essentially, management is paid and incentivized to protect an eroding asset, not to destroy and replace it.


