
In the last and final part of the trilogy, Horace discussed the Japanese automotive industry, and provided interesting insights into how Japanese car culture contrasts against the European and US counterparts. Using the innovator’s stopwatch framework, Horace explained the challenges on how Tesla, Google, Uber and Amazon could disrupt the car industry, and provide some thoughts on what approach Apple might take on creating the car if they are doing it
The Critical Path #150: Circling Back
Horace interviews Anders about Goldman Sachs’ investment in Internet finance company Circle and we take listener questions over Twitter.
The Asymco Trilogy with Horace Dediu Part 2 – Apple in Asia & Luxury – Analyse Asia with Bernard Leong
Horace Dediu, current fellow of the Clayton Christensen Institute and founder of Asymco.com joined us for an epic and insightful discussion focusing on few key interesting topics: (a) new market disruption theories, (b) Apple in China and the luxury market and (c) the Japanese automotive industry and how it shapes up against disruption from Tesla, Uber and Apple. In the second part of the trilogy, Horace discussed how Apple has managed to navigate the Asian markets with a combination of building the best product and building strategic partnerships with patience and grow the market with the right timing of the correct localised product, for example, the iPhone 6 Plus. Horace also pushed against the notion that Apple is really entering the luxury market, by applying “Jobs to be Done” perspective (used by Bob Moesta in his interviews) to the issue.
Schiller’s Law
We know how many iPhones Apple ships but we don’t know exactly how many of each model. We can try to come close in such estimates of “mix” by looking also at the market pricing of the phones and the average price Apple obtains1
Combining what we know with some guesses allows some of us to estimate the composition of iPhone models in any given quarter’s sales. Here is a graph showing my estimates:
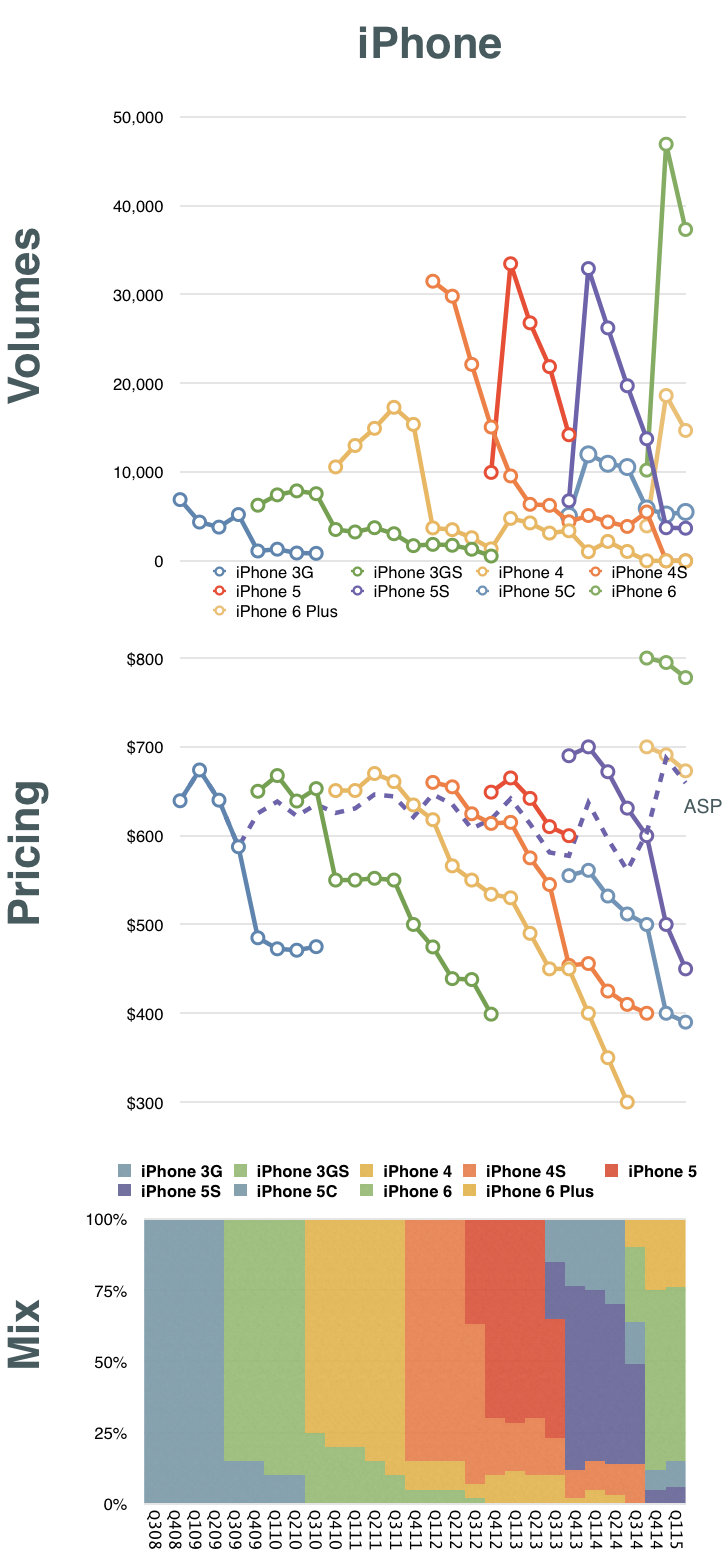
Having this, we can then assess how each generation of iPhones has performed. Remember that although we had a new iPhone for each of the last eight years, there are only 5 generations in total. Starting with the 3G (second generation) the generations were two yearly product cycles long.
The resulting estimates for generational growth are shown below. Continue reading “Schiller’s Law”
- ASP = Revenue/Units shipped. However, note that there are deferrals in revenue as part of this. [↩]
The Asymco Trilogy With Horace Dediu 1 – New Market Disruption by analyseasia
Horace Dediu, current research fellow of the Clayton Christensen Institute and founder of Asymco.com joined us for an epic and insightful discussion focusing on few key interesting topics: (a) new market disruption theories, (B) Apple in China and the luxury market and (c) the Japanese automotive industry and how it shapes up against disruption from Tesla, Uber and Apple. In the first of the trilogy, Horace discussed the origins of Asymco.com and also why he has used Apple as the lens to understand innovation and technology disruption. We also traced back to other Apple-like companies in the past such as Sony in Asia, and look at how Apple and Pixar has displayed a different kind of “DNA” against innovative companies in the past. Last but not least, we discussed the evolution and future of Google and where it might lead them to.
Listen to it here.
Unicornia
Unicorns typically are valued on the basis of number of users. While they are not yet monetizing those users, their growth and engagement metrics are expected to be off the charts. As there are no revenues (or profits) the $billion valuation hinges on a nominal value of $/user. That figure is based on comparable companies (e.g. Facebook) which do monetize their users.
Since the unicorn’s capitalization/user defines its valuation, which company should be considered comparable? Unfortunately they range widely. There are many alternatives. The graph below shows a few Market Cap/Mobile User rates ranging from $45 for Yelp to $747 for Alibaba.
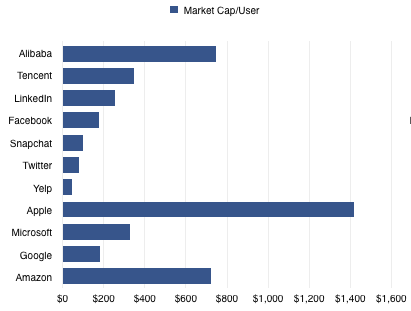
Note that I’ve also added companies which may not be considered as unicorn comparables because they are not usually valued on a per-user basis. Apple, Microsoft, Google and Amazon are priced by product sales, typically. However, most of them operate and self-define as service organizations. Microsoft has been “monetizing users” for decades using a recurring revenue model. It has a “SaaS” business logic for most of its revenues. Google1 likewise. Amazon reports its active users every quarter and obviously is measuring itself by that metric.
Apple2 is the least likely to be seen as a company whose value is a function of user base. Nonetheless it behaves entirely on that basis. The company’s entire strategy depends on satisfying its customers and building its brand which can only have one outcome: loyalty and repeat purchases. The services and software they offer can be seen as supporting that brand loyalty which is converted to profit through an above-average selling price.
Being mature of business model therefore does not exclude a company from being valued like all the kids are these days.
So, if we do look at the value/user metric we might as well look at the revenues, operating profit and growth data. Continue reading “Unicornia”
iPhone, killer
Searching for “iPhone killer” returns millions of hits. It’s hard to remember any phone/product/service/platform/initiative/merger/startup which was not at some point considered an iPhone killer. A sampling is offered here.
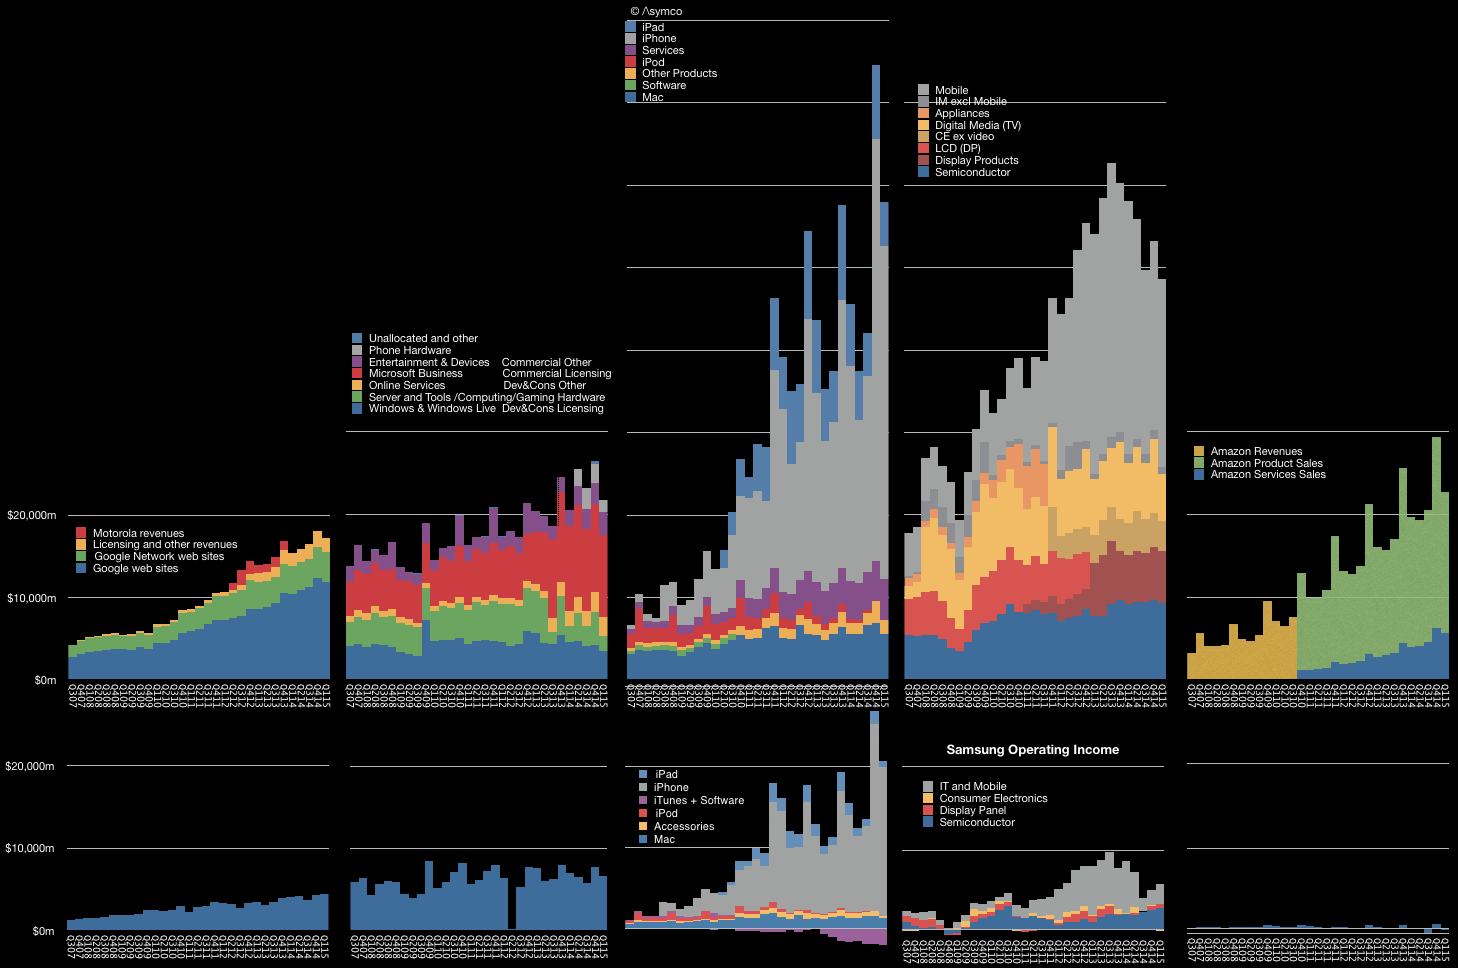
In reality, the killers seem to have all faded away while the iPhone continues. We could just shake our heads and move on, but a deeper analysis is possible. Take a look at the graph above. Note that iPhone’s (and hence Apple’s) ascent has not caused decline in its nominal competitors. When seen in the context of the graph above, the success of the iPhone has in fact been complementary to those companies who would be its killers.
Consider that the iPhone drives a large portion of Google’s revenues as it is the home to many Google services and engagement through the iPhone is higher than any other platform, including Google’s own. iPhone users tend to make better customers. In exchange Google pays a great deal for traffic acquisition on iOS devices. The placement of search on Safari is probably the biggest single cost item on Google’s income statement ((Estimates are a few billion dollars a year.))
The iPhone example drew Google to build Android as a facsimile and that, coupled with Brobdingnagian spending on marketing, led to Samsung’s Galaxy success. That success seems to have peaked and the brand is now a victim of low-end disruptors which copied it and the iPhone in turn. However, Samsung electronics benefits from the iPhone in terms of its semiconductor division. Apple is Samsung’s biggest customer and the semiconductor division is now the largest source of operating profits.
Winning Against Non-consumption
In the fourth quarter of 2013, mobile phone sales in mature regions fell due to weaker demand.”Mature markets face limited growth potentialis the markets are saturated with smartphone sales, leaving little room for growth with declining feature phone market and a longer replacement cycle,” said Anshul Gupta, principal research analyst at Gartner. “Lack of compelling hardware innovation has further exacerbated replacement cycles for high-end smartphones in 2013 because consumers don’t find enough reasons to upgrade.” – Gartner
Anshul Gupta’s assertion of market saturation was not the first. IDC also cited “a number of mature markets nearing smartphone saturation” in late 2013.
Shortchanging the smartphone market is nothing new. It was happening very early in the market’s formation when initial growth was not as rapid as expected. I recall Nokia managers disappointed with sales growth losing faith in smartphones in 2004. Eleven years later, the market is still growing.
comScore reported that during the first quarter of 2015 the US market was adding over two million new smartphone users every month. These are not two million units sold every month but two million new users who began using smartphones for the first time ever, every month.
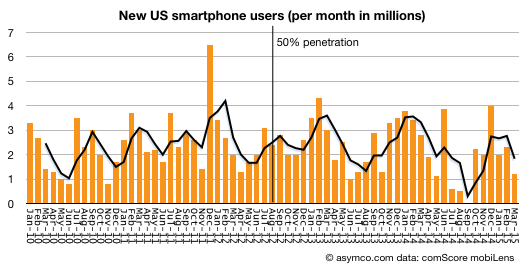
Since the end of 2013 when both IDC and Gartner declared the onset of saturation in “mature regions”1 31.5 million new-to-smartphones Americans adopted the product. That’s an addition of 11% of the sampled market.
And the sampled market is just a subset of the addressable market. comScore only counts ‘primary phones’ in use and excludes company-purchased devices and any users below age 13.
So according to comScore’s data, the US market is at 77% smartphone usage. My assumption is that saturation would come at the earliest at 90% and could be 100%.2 The fact that conversion to smartphones is still proceeding at roughly the same rate it has been for five years, makes this assumption pretty safe.
The pattern of growth fits a diffusion S curve (Logistic curve) as closely as ever: Continue reading “Winning Against Non-consumption”
The Instrument Makers | The Christensen Institute
When we think about how great theories are built, one pattern seems to pop up repeatedly: breakthroughs are preceded by the insight into one (n=1) insight. The key observation of an anomaly that disabused us of a false assumption leads us to a far deeper causal understanding.
I’ll illustrate with a simple history of astronomy. For millennia, the theory of astronomy was informed by data provided by our eyes. The human eye could observe celestial objects with great acuity, and with great patience and record keeping the recognition of patterns in movements allowed the building of a vast database of predictions about the universe. We see this in many societies around the world: from Nordic seafaring navigators to Mayan calendars to Greek scholars. They all built predictive models and associated mythologies around the observable night sky.
These models included a construct called the calendar, the horoscope, navigation charts and even rare event predictors such as eclipses. Computing devices were even built to allow the calculation of these events by laypersons rather than a priestly class.
Our eyes remained the observational instruments underpinning all these theories. The world (and otherworld) view was informed and repeatably tested through eyesight. It wasn’t until the technology of lenses was developed (initially for a completely different purpose) that new instruments could be used to augment the eye.
These telescopes (and their brethren, the microscopes) changed many theories profoundly. The information that optical telescopes could convey allowed the observation of anomalies (e.g. planets) which changed the earth-centric view of the universe which, in turn, challenged much of the balance of power in society.
Read more and comment: The Instrument Makers | Christensen Institute
How many iOS devices will Apple Ship in the next six months?
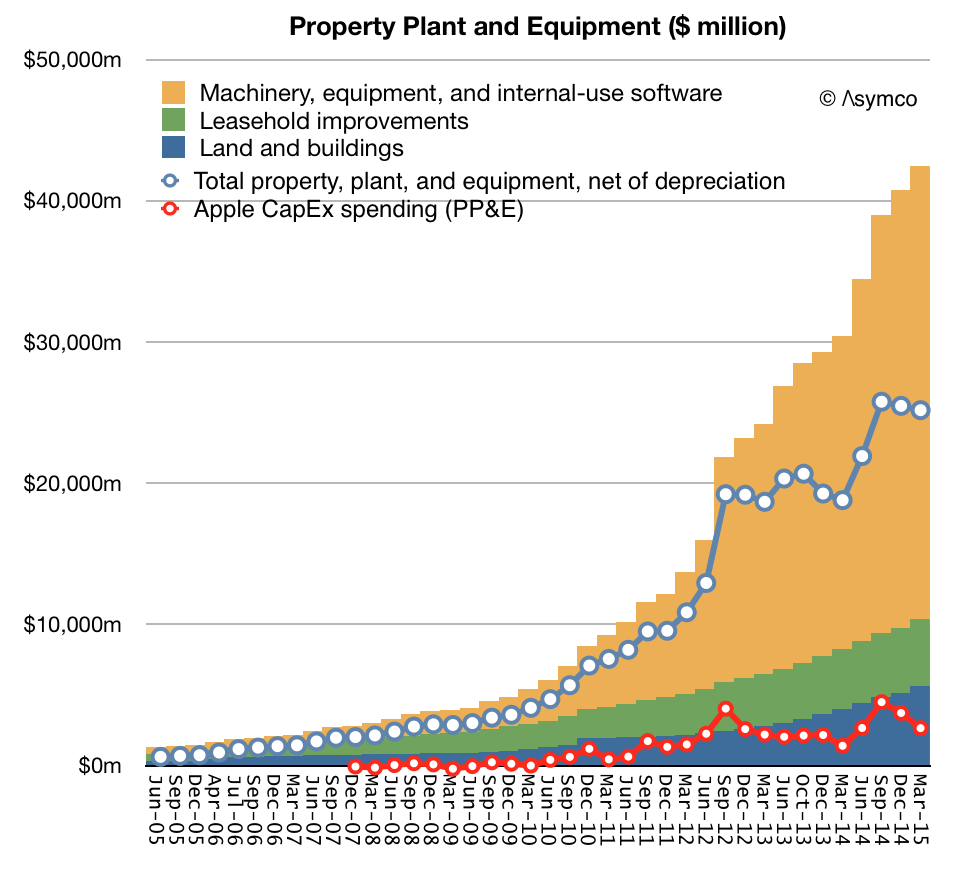
Of the $42.5 billion Apple spend buying capital assets1 more than half was acquired in the last three years. Net of depreciation these assets are currently worth $20.1 billion and the spending rate is about $12 billion per year.
This strategy of spending on capital assets is primarily in support of its particularly integrated approach to its product strategy. The purchasing of tooling for product manufacturing gives many benefits, including ability to deliver uniquely differentiated hardware, a predictable ramp and availability of parts throughout the product lifecycle.
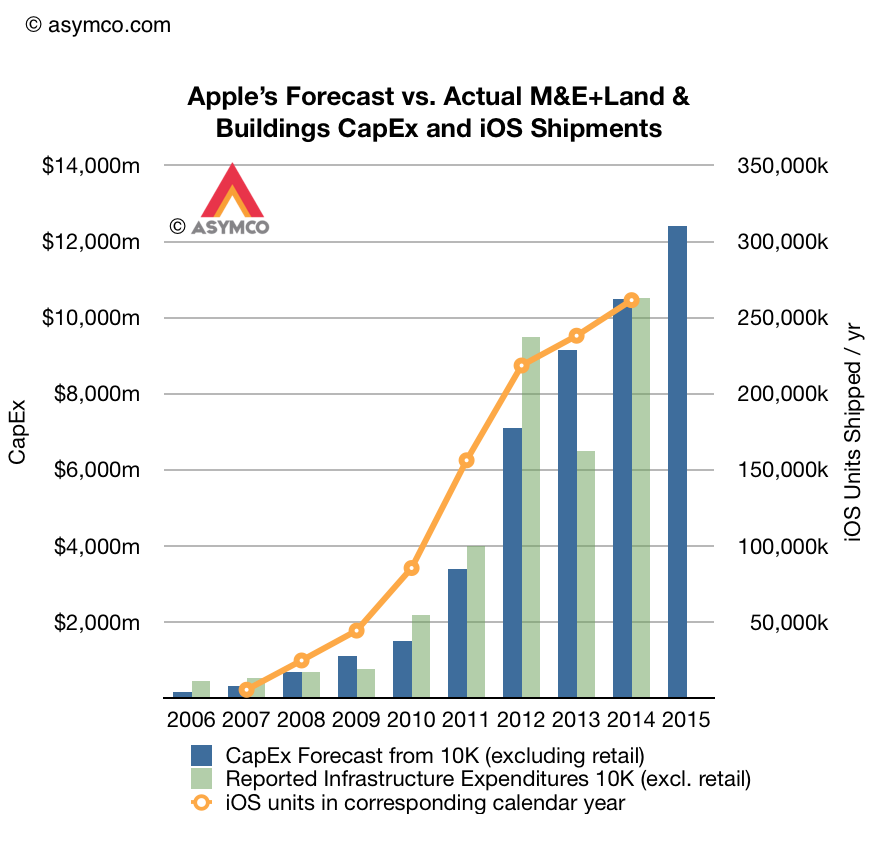
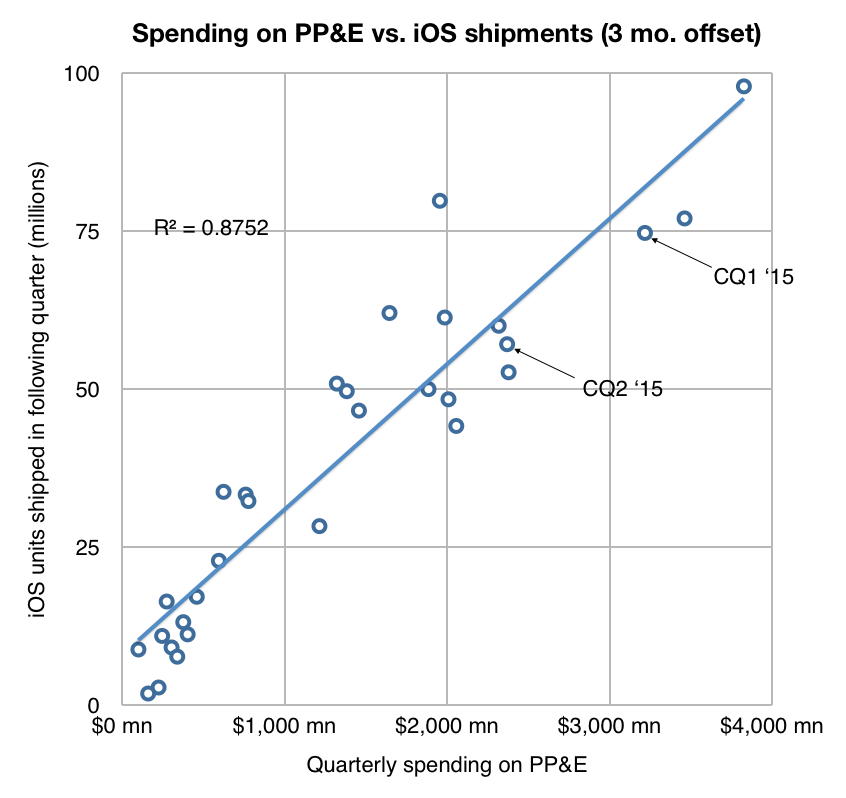
One additional benefit (for us) is that we get to inspect the allocation of resources prior to production and therefore we can more easily forecast the product’s supply. Spending on tooling happens in advance of production and the company also provides full year predictions of its spending.
The fiscal year forecasts relative to actual spending is shown below. Note the correlation with iOS units shipped one quarter after the spending was booked.
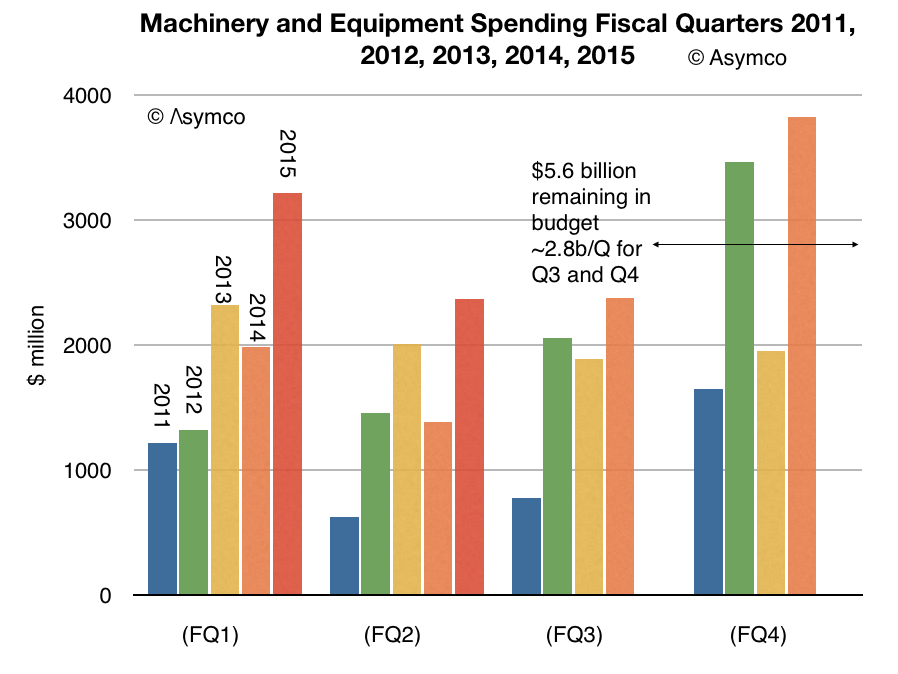
After reporting its second quarterly earnings, we received an update on what amount to half of the full year’s spending giving us only two more quarters of variability. The current projections for the next two quarters imply about $2.8 billion per quarter spending.
The pattern from previous years is shown below for comparison. Note the Even/Odd year patterns.
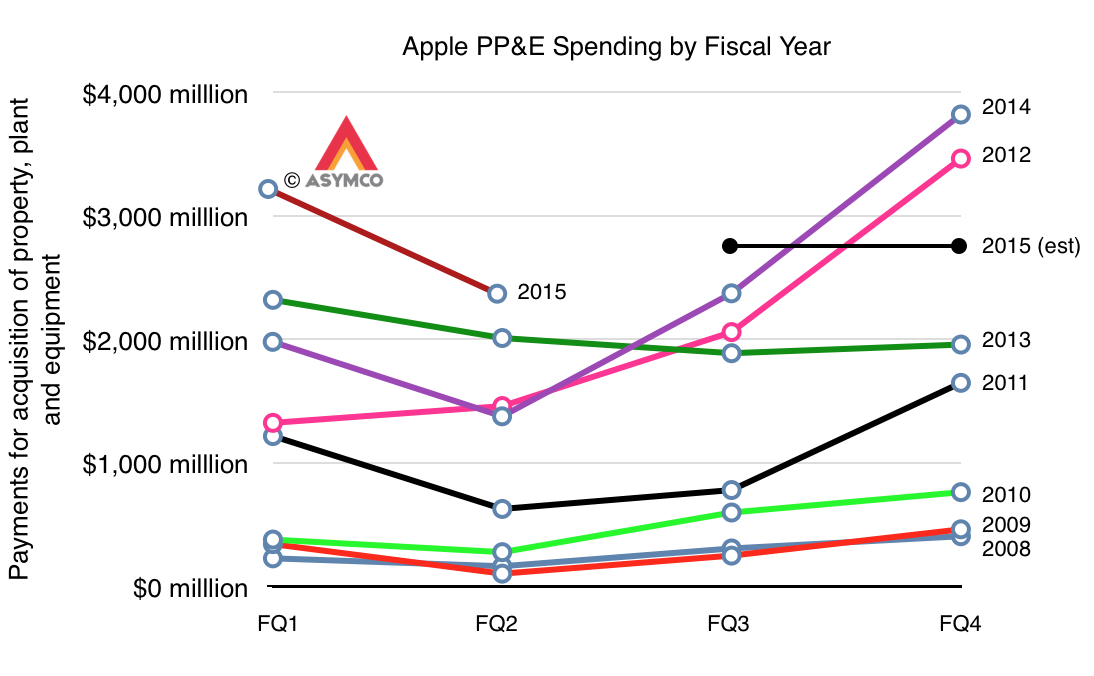
The company also offered revenue guidance for FQ3 and therefore we can even make an educated guess on the next data point (57 million iOS devices) on the following graph:
The result is likely to be 120 million shipped between April and September.
It’s remarkably predictable.
- Includes land and buildings $5.6b, Machinery, equipment and internal-use software $32.1b and Leasehold Improvements $4.7b [↩]