In October 2013, at the end of its last fiscal quarter, Apple stated:
The Company’s capital expenditures were $7.0 billion during 2013, consisting of $499 million for retail store facilities and $6.5 billion for other capital expenditures, including product tooling and manufacturing process equipment, and other corporate facilities and infrastructure. The Company’s actual cash payments for capital expenditures during 2013 were $8.2 billion.
The Company anticipates utilizing approximately $11.0 billion for capital expenditures during 2014, including approximately $550 million for retail store facilities and approximately $10.5 billion for other capital expenditures, including product tooling and manufacturing process equipment, and corporate facilities and infrastructure, including information systems hardware, software and enhancements.
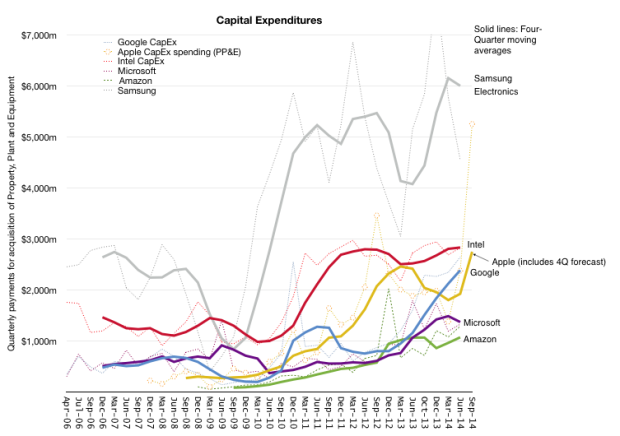
These 10K (fiscal year annual) forecast figures for capital expenditures are shown in the following graph. Note that they also include the fiscal years from 2006 to 2012. Note also that the graph includes the actual expenditures (in green).
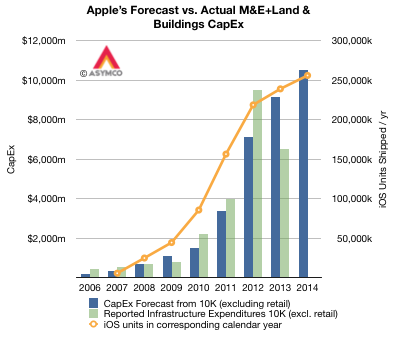
From 2006 through 2013 the sum of the forecasts was $23.445 billion while the sum of the expenditures were $24.662 billion. With the exception of a carry-forward in 2012, the forecasts are broadly in-line with expenditures, with about 5% more spent than forecast.
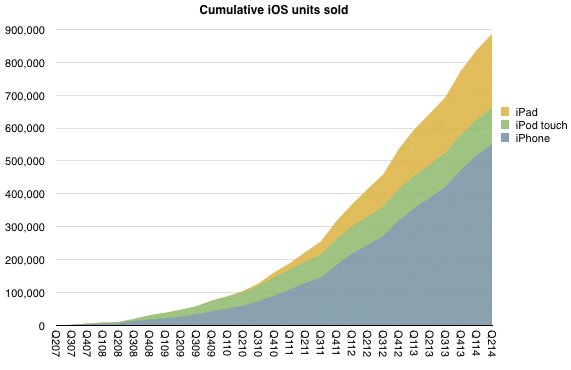
This pattern of accuracy in spending makes a $10.5 billion expenditure during the current fiscal year believable. In other words, taking the forecast at face value, and given that three quarters of the fiscal year have already passed, what does it imply for the current and last quarter? The following graph shows what Q3 spending should be relative to previous quarters (and 2011, 2012 and 2013). Continue reading “Best guess for how many iOS devices will ship in 2014”