
Horace and Moisés catch up on a few weeks of topics, from Apple earnings to iPad discontinuity to ecosystem disparity to followup on ComiXology. Why would you ask a freshwater fish what it’s like to live in the open sea?
Measuring Not Getting the Cloud
This is what “Not getting the Cloud” looks like:
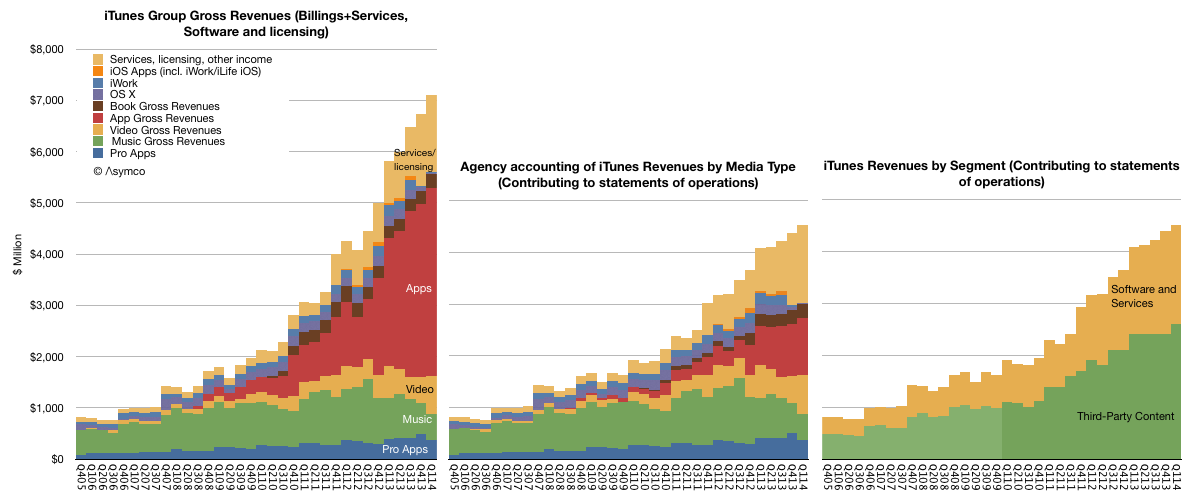
“Not getting the cloud” means that in the last 12 months Apple obtained:
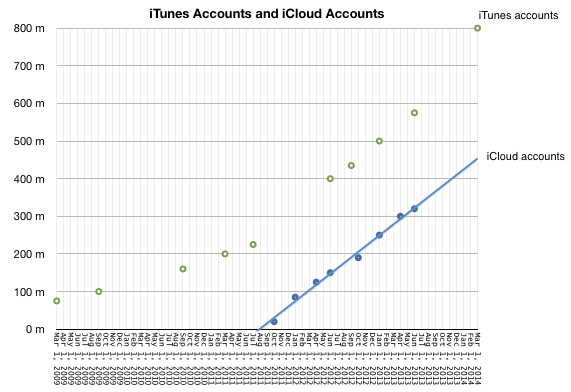
- 800 million iTunes users and
- an estimated 450 million iCloud users spending
- $3 billion/yr for end-user services plus
- $4.7 billion/yr for licensing and other income which includes
- more than $1 billion/yr paid by Google for traffic through Apple devices and
- $13 billion/yr in app transactions of which
- $9 billion/yr was paid to developers and
- $3.9 billion/yr was retained as operating budget and profit for the App Store. In addition,
- $2.7 billion/yr in music download sales and
- more than $1 billion/yr in Apple TV (aka Apple’s Kindle) and video sales and
- $1 billion/yr in eBooks sold
In summary, iTunes, Software and Services has been growing between 30% and 40% for four years and is on its way to $30 billion/yr in transactions and sales for 2014.
This is what can be deduced from a reading of Apple’s financial statements of operations. If there are comparable details for companies which do get the cloud, I’ll be happy to tally the comparison so we can calibrate this failure.
How close is the UK to smartphone saturation?
In How close to saturation is the smartphone I highlighted that the US is not nearly saturated at 68.8% penetration at the end of March. Since the US is not the highest penetrated, one may wonder whether other “developed” countries are far further along.
There is no data on all the countries in the world on the same resolution as that in the US, but thanks to Charles Arthur, Kantar shared data on the UK and we can have a clear trajectory for that country.
The most recent data for UK was as of February 2014 when penetration was 70%.
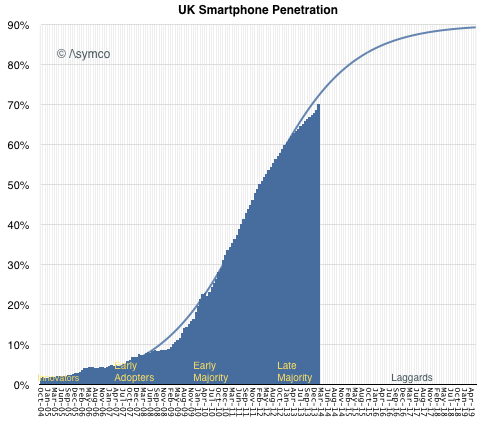
In February the US figure was 68.2%, so the US is 1.8% behind in penetration. The equivalent picture of the US is below: Continue reading “How close is the UK to smartphone saturation?”
How close to saturation is the smartphone?
The US is not the market where penetration is highest. However, it is the largest market where we have reliable penetration data (from at least two sources) and the one where penetration is near the top of the range.
The graph showing the US ranked against others as of a year ago is here. The US was cited at 56.4% at the time. I keep track of comScore’s data and it showed 58.2% at the end of March and 55.3% at the end of January, making the figure very believable.
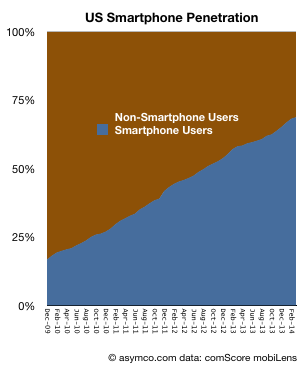
The most recent data from comScore shows penetration at 68.8%. In order to understand what the limits of that growth could be it’s important to see the longer-term pattern. It would show whether there is a clear point of inflection and thus a predictable “saturation” around an asymptotic value.
The following graph shows the percentage of smartphone users/non-users since late 2009.
The following graph shows the rate at which users are being added to the smartphone ranks (measured as new users per month.)
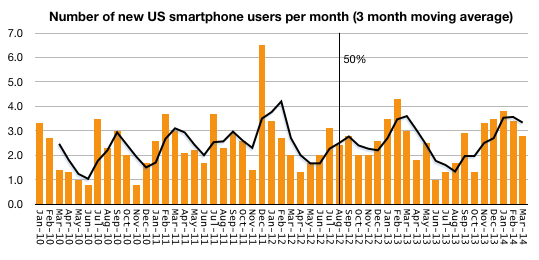
To summarize, the conversion of users from non-smart to smartphone usage is fairly constant. The March ’14 period saw 2.8 million new-to-smartphone users. the March ’13 period saw 3.0 million, the March ’12 period saw 2.0 million and March ’11 saw 3.0 million. There is no discernible slowing of adoption.
Note that I added a trailing three period average in new users which fluctuates somewhat predictably due to seasonality. Finally, note that the figure of 50% penetration was reached almost two years ago and no noticeable change of adoption has happened since. Cellular phone ownership in the US is still rising (though very slowly) and it now about 90%.
The only conclusion is that even at the current 68.8% penetration, we are not anywhere near “saturation” of smartphone users in the US, and the US is a leader among “developed markets” so there is little to suggest that saturation has happened anywhere with significant populations.
The iPad discontinuity
iPad sales were unexpectedly slow in Q1. Tim Cook explained it as follows:
iPad sales came in at the high end of our expectations, but we realized they were below analysts’ estimates and I would like to proactively address why we think there was a difference. We believe almost all of the difference can be explained by two factors.
First, in the March quarter last year we significantly increased iPad channel inventory, while this year we significantly reduced it.
Second, we ended the December quarter last year with a substantial backlog of iPad mini that was subsequently shipped in the March quarter whereas we ended the December quarter this year near supply demand balance.
We continue to believe that the tablet market will surpass the PC market in size within the next few years, and we believe that Apple will be a major beneficiary of this trend.
Tim Cook went on to say “over two-thirds of people registering an iPad in the last six months were new to iPad”
In a later discussion, Luca Maestri said:
As Tim explained earlier, our iPad results and the comparison to the March quarter last year were heavily influenced by channel inventory changes. Specifically, this year we sold 16.4 million iPad into our channel and sold through almost 17.5 million, reducing our channel inventory by 1.1 million units.
Last year, we sold over 19.4 million iPads into our channels and sold through 18 million, and therefore increased channel inventory by 1.4 million units. As a result, the year-over-year sell through decline was only 3% compared to the sell-in decline of 16%.
We exit the March quarter with 5.1 million of iPad channel inventory which left us within our target range of four to six weeks. iPad continues to lead all other tablet by far in terms of user engagement, size of ecosystem, customer satisfaction and e-commerce.
In a later Q&A: Continue reading “The iPad discontinuity”
Monthly Apple Users
In the postmodern computing world that we live in, the measure of success isn’t revenue or profit or units sold but the number of users that an ecosystem can attract. Therefore the monthly active user (MAU) unit of performance seems to be in vogue right now. E.g.:
- Facebook claims Messenger has more than 200 million MAUs
- WhatsApp has 500 million MAUs, 48 million of whom are in India
- Line last month announced that it had 400 million users (active or not)
- WeChat claimed 355 million MAUs
- Viber claims 105 million MAUs
Startups are aggregating these millions of MAUs in order to obtain valuations for raising capital1 and the faster the growth in MAUs the more “successful” the company is considered.
When companies are acquired it’s common to take the transaction value and divide it by MAUs to get an idea of “what an user is worth”. This is because there are no revenues to measure and MAUs are taken as a proxy. However, the process by which a MAU becomes a dollar of profit is, to put it kindly, circuitous.
For most (all?) it’s not yet clear how it happens especially since not all MAUs are created equal and MAU loyalties can change rapidly and if we added all the projected revenues each MAU will contribute to each app on her device we might reach some absurdity. In actuality, today, for the companies listed above, there are no revenues at all directly from their services.
In violation of this convention, there are some companies which manage to obtain revenues from their users. Two such are Apple and Amazon. In the last quarter Apple reported having 800 million iTunes accounts.2 These aren’t MAUs since the activity level is not noted, but we do know how much is spent on iTunes and services. In addition, Amazon cites 244 million active customer accounts representing accounts which generated purchases within the last 12 months.
This allows us to compare Apple and Amazon in terms of accounts, revenue per account, and, via some analysis, even profitability per account.
The following graphs tell this story. First, the total number of accounts:
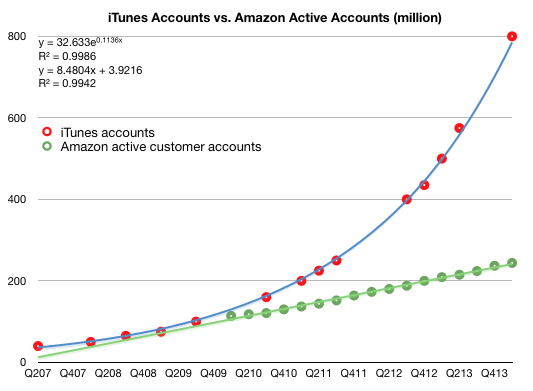
Note that I added trend lines to both graphs and their formulas.
The following are the revenue per account for iTunes (further broken into estimated iTunes segment revenues per account.) and for Amazon. Note that the vertical scales are different. Continue reading “Monthly Apple Users”
Innovation Talk: Overuse of word innovation has blurred its true meaning – Business News | Latest News Stories | The Irish Times – Mon, Apr 28, 2014
“Innovation” is one of those words that, through casual overuse, has come to signify a wide array of distinct concepts – in some sense, the word is literally losing definition, like an out-of-focus photograph that manages to become blurrier every time you look at it.
These days, anytime anyone does something vaguely new, or a new feature gets added to some gadget or other, the innovation word gets flung about. Indeed, the word is used with the same reckless abandon as those other favourites of jargon-loving MBA types, “solutions” and “disruption”, rendering it increasingly meaningless.
More from Davin O’Dwyer: Innovation Talk: Overuse of word innovation has blurred its true meaning – Business News | Latest News Stories | The Irish Times – Mon, Apr 28, 2014.
Surprise
After n quarters of predictability, Apple surprised with sales performance that was 3.74% above the top of their guidance. This may not seem significant but since instituting a new range-bound guidance method in Q1 of last year the company reported revenue within about 1% of the top of the range.
This is in stark contrast to the wide variance in prior years. The following graph shows the “error” in guidance as the percent difference between reported sales and guidance1.
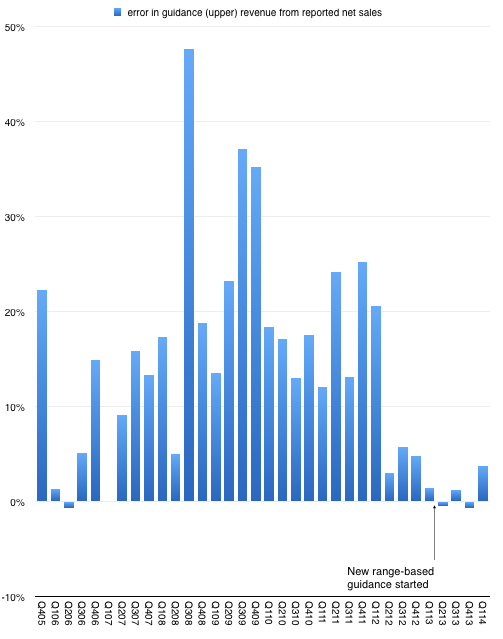
So prior to last quarter we were lulled into thinking that guidance was very nearly perfectly predicting the company. As I tweeted, it took the “sport” out of trying to do any forecasting. All an analyst had to do is tweak the main product growth figures to hit the sales target and then subtract the (generously provided) operating expenses and (also provided) tax rate to get the earnings. Only unknown to getting to an estimate of EPS was how many shares would still be outstanding.2
Knowing Apple also means that average selling prices are also very rigidly set in stone so the degrees of freedom in analysis were becoming highly constrained.
But just when you think you spotted a pattern, it changes. The company surprised with performance outside the band. The following graph shows the estimate ranges it has given and the actual revenues delivered.3 Continue reading “Surprise”
On the future of Google. Part 2
In Part 1 of a look at Google’s future I showed that Google’s revenues have been highly correlated with the population of Internet users in the markets it serves. If there were a causal relationship between population of users and revenue growth then the company would face a growth inflection point when that population becomes half penetrated.
In Significant Digits Episode 1 (Part 1) I showed data which suggests that the inflection point will come in 2016. Essentially the argument is that Google’s growth is ultimately limited by the population of users and that itself is a predictable number. I also used the example of the PC and smartphone penetration curves to show how the perception of the fortunes of companies whose revenues are based on those technologies were affected by inflections in their respective adoptions.
However, correlation is not causation. These users we count are not the customers who pay for Google’s services. Users (or usage) is therefore only a proxy. It may be a good proxy and intuitively it makes sense that it’s a driver of growth but fundamentally the company lives on a stream of revenues paid by advertisers1. In order to really evaluate the opportunity we need to “follow the money” and track down where it comes from.
We don’t have visibility into the exact sources of these revenues but we have a top-level geographic segmentation (shown below.) Continue reading “On the future of Google. Part 2”
- This is true to date and certainly it could change but hints of how that might change are still not visible to me [↩]
Ruby on Rails Podcast #146: Horace Dediu of Asymco – Open Source Software
Sean Devine has a conversation with Horace Dediu of Asymco about open source software.
via 5by5 | Ruby on Rails Podcast #146: Horace Dediu of Asymco – Open Source Software.