For more analysis of Apple & the industry, join us at ACTIVE 2025.

Asymconf Program

9:00 to 10:15 Being Back. How California came to disrupt

The disruptive history of California is remarkable. Whereas few nations can claim credit to one, California is home to at least four major disruptions: Semiconductors, recorded entertainment, venture capital and personal computing. And it did all this in less than one century. If any one place can vie for the title of “serial disruptor” it’s California. One success can be seen as luck, but many successes imply a system is at work. In this case session we discuss California’s disruptive history and put forward hypotheses on the what causal mechanisms are at work. We ask further whether California can still be the home of future disruptions or whether the system has broken down.

  • The effect of “frontier mentality” on unforeseen growth
  • The effect of migration and diaspora on innovation and counter-effect of the absence of either.
  • Applying these causal themes to the management of innovation in institutions

10:15 to 10:30 Break

10:30 to 12:00 Designed in California, Assembled in China

Geographically and culturally, California is closer to Asia than any other western market. It has always faced west more than it has faced east. Is there a symbiosis between California and Asia? Are its institutions adapting to a new center of economic mass? Is California leading in thinking or culture or is it being disrupted by a new frontier as growth moves east?

  • The growth in Asia and China in particular is in many ways a reflection of rapid industrialization. But it can also be seen as a low-end disruption.
  • What can be learned about business model innovation in the contrast between Californian and Asian approaches to business?
  • Does culture play a part in an innovation mentality?

12:00 to 1:00 Lunch

1:00 to 2:15 Guest presentations and Panel session

Guests are invited to debate or discuss points raised during the morning sessions. A chance for panelists to challenge or refute points made as well as for the provision of anecdotal evidence.

Potential panelists:

  • Ben Bajarin
  • Michael Lopp (aka @Rands)
  • Jean-Louis Gassée
  • Om Malik
  • Charlie Kindel
  • Dan Benjamin
  • Philip Elmer-DeWitt
  • Tim Bradshaw

2:15 to 2:30 Break

2:30 to 4:00 North vs. South

Does the tension between industries of Northern California and Southern California reflect an opportunity or a crisis? We will re-visit the narrative of what Entertainment is hired to do. We will review the differences and similarities of the technological creative process vs. the artistic creative process. We will see whether industrialized, commercialized art is subject to disruptive forces or whether there is persistent exceptionalism at work.

  • Is the intersection of “liberal arts” and “engineering” more than a metaphor?
  • What can be learned by cross-pollination of the creative processes of engineers and artists.
  • What’s the future of technology-based entertainment? Are North and South closer and have more in common than the war talk lets on?

4:00 to 6:00 Reception

Please register here.

Samsung Electronics Segment Revenues and Operating Income in Context

As first introduced last week, Samsung’s revenues have grown primarily due to the expanding volumes of smartphones. In today’s post I convert the revenues and operating incomes to US Dollars and compare them to a set of companies.

First, I should note that Samsung has changed both the designation of its divisions and the way it reports revenue. Broadly speaking, Samsung Electronics has four major divisions:

  1. Semiconductors. This includes memory products as well as systems such as CPUs.
  2. Display products. This used to be called “LCD” but has been re-named Display Products.
  3. Telecom. This is mainly mobile phones but includes additional products and services for telecom operators and PCs. The division has recently been re-named IM (IT and Mobile communications).
  4. Consumer Electronics. This group has changed names from Digital Media and Appliances to CE. The majority of sales value comes from televisions but also includes consumer electronics and appliances.

The company further combines Semiconductors and Display Products into a group called DS (Device Solutions) and Consumer Electronics and IM into DMC (Digital Media & Communications).

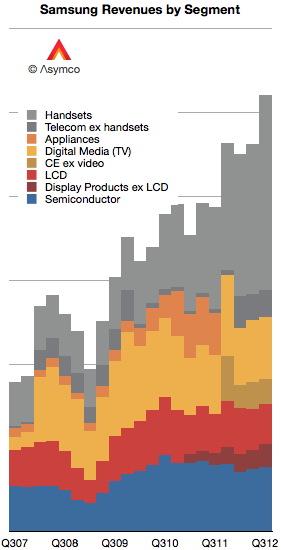
I tried to reconcile these various nomenclatures with color coding in the following graph. Semiconductors are blue, Display components are red, Consumer Electronics are Yellow and Mobile are grey.

Each gridline represents $10 billion.

Continue reading “Samsung Electronics Segment Revenues and Operating Income in Context”

The cost of selling Galaxies

In the post “Google vs. Samsung” I compared the profits of Google and Samsung Electronics’ mobile (aka Telecoms) division. It showed how Samsung has grown its mobile business to such a degree that, if sustained, could conceivably influence the way Android is controlled.

However, we should not analyze Samsung’s mobile group in isolation of the entire company. Samsung relies on internal transfer of technology and capacities of production which are quite unique for device vendors today. In other words, Samsung is a relatively integrated enterprise. Understanding the whole is necessary before understanding the part.

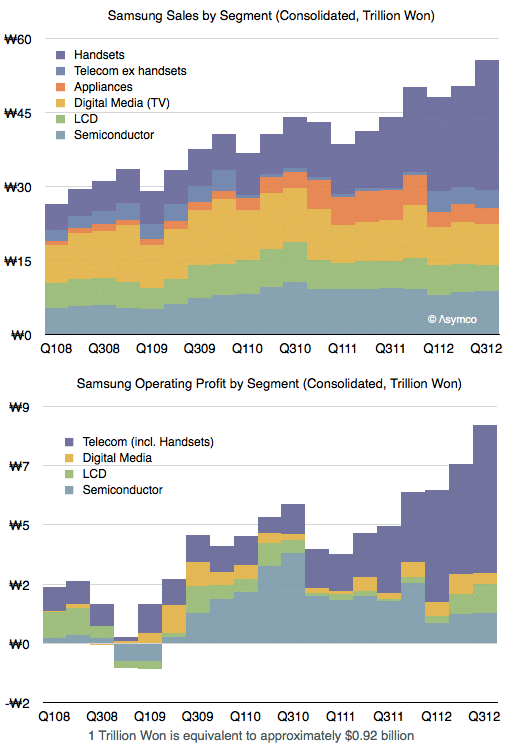
The following graph shows the sales and operating profit for  Samsung Electronics as a composite of its divisions since early 2008.

As one would expect, the mobile group (Telecom) is the source of both top and bottom line growth. The group has also been leading in terms of margins and increasing those margins steadily.  Continue reading “The cost of selling Galaxies”

5by5 | The Critical Path #65: The Shoe Seller's Dilemma

An update on Asymconf California, a discussion of engagement and why Android does not get enough of it, why Amazon likes giving away Fires and the causal hypothesis of Samsung’s success in smartphones. That plus announcing a new 5by5 show: High Density.

via 5by5 | The Critical Path #65: The Shoe Seller’s Dilemma.

Validating the Android engagement paradox

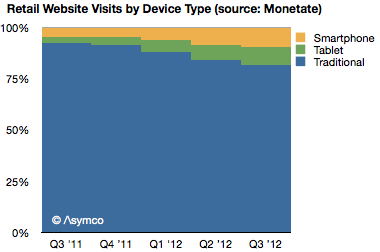
Following yesterday’s IBM data, Monetate released a new study showing similar data related to retail browsing but covering a period of dates from Q3 2011 to Q3 2012.

This data also shows an acceleration of mobile shopping, from 7.7% of online in Q3 2011 to 18.8% in Q3 2012.

It also shows tablets growing to take about half of mobile traffic in a very short time frame.

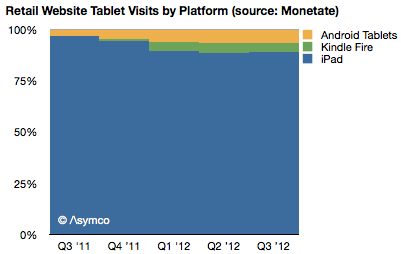
The data also shows the iPad taking the vast bulk of traffic among tablets (88.9% vs. 88.3% from IBM). Continue reading “Validating the Android engagement paradox”

The Android engagement paradox

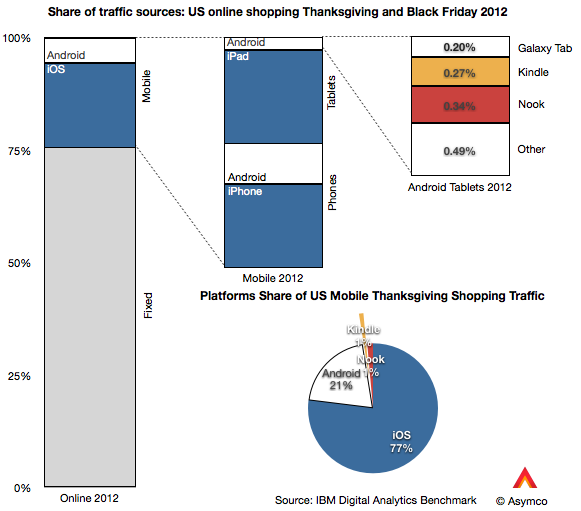
IBM’s Digital Analytics Benchmark reported US Black Friday sales and the news is reasonably good. Overall online sales grew by 17.4% while mobile grew to make up 24% of traffic.

The data goes further to show the split between device types. I illustrate this split with the following graphs:

Of the 24% of traffic made up by mobile devices, phones contributed 13% and tablets 11% (or 54% and 46% of mobile respectively). Of the phone traffic, iOS devices were about two thirds of traffic and Android one third. Of tablet traffic, iPad was 88%, Kindle and Nook were 5.5% Galaxy Tab was 1.8% and other tablets were 4.4%.

Overall, iOS was 77% generated mobile traffic and Android (excl. Kindle, Nook) was 23%.

That’s an interesting snapshot of the consumption of mobile devices, but is there a pattern here? Continue reading “The Android engagement paradox”

5by5 | The Critical Path #64: Mano a Mano

A dialogue with Benedict Evans, mobile analyst. Benedict has observed not only the technology and telecommunications industries as an equities analyst but also worked for an operator and a major media company. We take a look at mobile strategy and what the media industry will evolve into.

via 5by5 | The Critical Path #64: Mano a Mano.

The iPhone Addressable Market

The iPhone is a severely constrained product. We’re used to thinking that it’s production constrained—and it is, but it’s also distribution constrained. It has a business model that is almost completely dependent on operator subsidy. Few end users pay the $650 average price that Apple obtains and that price point has held for a remarkably long time. This price point is largely invisible to the user.

In this regard it’s very different from all the other products Apple sells. Historically, the company has preferred having its customers to also be its users and maintained a direct relationship with them, strengthening that relationship through its own retail channel for the last decade. Pricing is used by Apple as a signal to clearly illustrate value to the user and pricing is part of the communication about the product that Apple makes very explicit. This has been true for the iPod and Mac and is still true of the iPad. But this is not so for the iPhone. The entire marketing strategy for the iPhone (and hence the entire product concept itself) is “off message”.

Why is this?

Continue reading “The iPhone Addressable Market”

The cost of mobile clicks

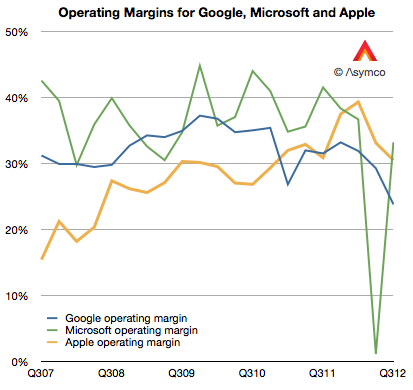
Google’s operating margins fell to 23.7% last quarter. This level is the lowest I’m aware of. From 2007 to late 2009 margin went from about 31% to about 37%.  Then from early 2010 until present they fell. The history is shown the the following graph.

[I included Microsoft and Apple operating margins for comparison.]

Some of the recent decline is due to the inclusion of Motorola into consolidated earnings. Motorola gross margins were therefore 18%. Excluding Motorola, Google gross margins (Revenues-Cost of Revenues) were 61.5% of revenues.  However, even excluding Motorola, Google’s core margins dropped. Continue reading “The cost of mobile clicks”

Asymco

Asymmetric Competition

Skip to content ↓