Traffic Acquisition Costs

In June of this year Apple reported that it had paid a total of $100 billion to developers. That is the 18th such figure given in the 10 year history of App Store, making the progress of payments and hence revenue and spending easily trackable.

The other regularly reported figure is the business segment revenue where App sales are currently allocated. Now called “Services” this omnibus segment includes many other sources of revenues such as:

  • Digital Content (Books, Music downloads, Video downloads–including TV shows and movies and movie rentals.)
  • AppleCare, Apple’s extended warranty service.
  • Apple Pay, transaction fees
  • Apple Pro Apps, including Final Cut, Logic Pro, Motion, Aperture
  • Licensing including “Made for iPhone/iPad”
  • One-time settlements of various lawsuits.
  • Other Services revenues which include
    • Apple iCloud-related services
    • Music Match
    • Music subscriptions
    • Other third party subscriptions (commissions)
    • Third party licenses

This combined Services segment is significant with $35 billion revenues in the last 12 months. This is quite a jump from 2016 when Services had crossed $25 billion. At the end of 2016 Apple said it expected Services revenue to double by 2020. With a growth rate since then of 25% the company is on track to reach its target one year early.1

Consumer spending on Apple services includes more than what it books as revenue since only the (typically) 30% of App Revenues is considered Apple’s revenue. Including the payments to developers, Services generated over $65.5 billion/yr in billings. This will reach $100 billion/yr in 2 years. The difference between reported revenues and consumer spending is shown in the following graphs.

I described the visibility into App Store revenues (which is the orange area in the graphs above) but the other sub-segments of Services are much more difficult to ascertain. Of special interest is Other Services which includes very high margin services. As part of that there is a peculiar source of revenues: Google.

It’s known that Google pays Apple for the default placement of Google search within Safari on iOS and Mac OS. That payment is registered by Google as a “Traffic Acquisition Cost” or TAC. TAC is essentially payment for distribution where what is granted by the distributor is access to queries (traffic.) This way Apple acts as distributor for Google. So, for that matter, does Firefox which also receives TAC payments.

What is peculiar is that the amount of TAC paid by Google to Apple is becoming staggering.

A few years ago Google was paying over 20% of its revenues as TAC. Recently that ratio rose to 23%. Bernstein analyst Toni Sacconaghi estimated that Google paid Apple $1 billion in 2014 as TAC and that payments to Apple were about $3 billion in 2017. Now Goldman Sachs analyst Rod Hall estimates Google could pay Apple $9 billion in 2018, and $12 billion in 2019.

This is starting to look interesting but is it believable?

My own estimate of Apple’s Other Services (which includes TAC revenues) is a run rate of $15 billion for calendar 2018. This makes $9 billion (60%) from Google quite challenging but not impossible. The remaining $6 billion needs to account for Apple’s own cloud and subscription service revenues.

Does this make sense given Google’s spending? TAC payments to distribution partners in Q2 were $3 billion. The $9 billion/yr assumption implies a $2.25B/quarter payment to Apple. That would be 75% of Google’s distribution costs. That also sounds reasonable given the high utilization of iOS relative to any other platform.

An increase to $12 billion for next year is also quite a claim but it certainly is possible. I don’t have a basis for making this estimate but the assumption of growth leads me to conclude that the payments are tied to actual traffic generated.

In other words the two companies have an agreement that Apple is paid in proportion to the actual query volume generated. This would extend the relationship from one of granting access for a number of users or devices to revenue sharing based on usage or consumption.

Effectively Apple would have “equity” in Google search sharing in the growth as well as decline in search volume.

The idea that Apple receives $1B/month of pure profit from Google may come as a shock. It would amount to 20% of Apple’s net income and be an even bigger transfer of value out of Google. The shock comes from considering the previously antagonistic relationship between the companies.

The remarkable story here is how Apple has come to be such a good partner. Both Microsoft and Google now distribute a significant portion of their products through Apple. Apple is also a partner for enterprises such as Salesforce, IBM, and Cisco. In many ways Apple is the quintessential platform company: providing a collaborative environment for competitors as much as for agnostic third parties.


  1. To calibrate this consider that Facebook revenues for the last 12 months were $48 billion and it now has a market capitalization of $468 billion or 41% that of Apple whereas Services consists of about 14% of Apple’s total revenues. []

Lasts Longer

I think Lisa Jackson’s presentation at the September 2018 iPhone launch event was perhaps the most interesting and most profound.

Lisa Jackson is Apple’s vice president of Environment, Policy and Social Initiatives. Previously, Ms. Jackson served as Administrator of the U.S. Environmental Protection Agency (EPA). In her role at Apple she has been responsible for the transition to 100% renewable energy use by Apple across all its facilities.

This goal has been achieved and it’s a remarkable achievement deserving congratulations. But her presentation was noteworthy for setting a new goal.

She laid out a goal for Apple to eliminate the need to mine new materials from the Earth.

She said that to reach that goal Apple will have to do three things:

  1. Sourcing recycled or renewable materials for all products.
  2. Ensure that Apple products last as long as possible.
  3. After a long life of use, ensure that they are recycled properly.

It’s this second point that I thought would bring the house down.

To emphasize the second point she said Apple now strives to design and build durable products that last as long as possible. That means long-lasting hardware coupled with long-lasting software. She pointed out that iOS 12 runs even on iPhone 5S, now five years old. Because iPhones last longer, you can keep using them or pass them on to someone who will continue to use them after you upgrade.

She said that “keeping iPhones in use” is the best thing for the planet.

At this point in the presentation I wondered if everyone would rush out of the room and call their broker to sell Apple shares. One premise of investing in durable goods hardware companies is that value depends on frequency of upgrades. If products are not replaced frequently they do not generate revenues and the company selling them ends up growing very slowly if at all after markets saturate. The smartphone business is certainly approaching saturation and the implication of making Apple products more durable would imply lower revenues from replacements. This anxiety around replacement rates and extended lives is used by analysts to discount future cash flows and if those lifespans are extended price targets come down.

So why would Apple want to do this?  What is the logic of this durability focus as a business model? It may be good for the environment but is it good for the bottom line?

Of course, there would be not much business without an environment and we should all strive for sustainability.  But this is an existential observation, and it’s defensive. The important call to make is that Apple is making a bet that sustainability is a growth business.

Fundamentally, Apple is betting on having customers not selling them products.

The purpose of Apple as a firm is to create and preserve customers and to create and preserve products. This is fundamental and not fully recognized.

To understand how this works, if you look at the pricing graph below, you can read it as a story of increasing prices for a decreasing market share. But if you understand that each advance in products increases absorbable1 utility then the cost per use remains steady or declines.

An iPhone at $1200 may be less expensive than an iPhone at $600 if the $1200 version lasts twice as long as is used twice as much each day. The $1200 phone delivers 4x the utility at twice the price, making it half the price. By making more durable products, both in terms of hardware and software, the customer base is satisfied and preserved.

Practically, the initial buyer may resell the iPhone and that 2nd hand devices may be sold yet again. This means an iPhone could have three users over its life and thus it could end up expanding the audience for Apple by a factor of 2 or even 3.

The expanded audience is offered accessories, additional products such as wearables and, of course, services. These residual business models are certainly profitable, perhaps even more so than the iPhone.

Overall Apple has 1.3 billion devices in use and perhaps as many as 1 billion users. This base is certain to expand and it will expand more rapidly with durable devices and software.

This is a hardware-as-platform and hardware-as-subscription model that no other hardware company can match. It is not only highly responsible but it’s highly defensible and therefore a great business. Planned obsolescence is a bad business and is not defensible.

Therefore the statement that Apple now prioritizes device and software longevity is very important and I consider it one of the most important statements made during the 2018 iPhone launch event.

  1. Insoluble  utility is very dangerous and it’s important to qualify e.g. higher storage capacity that people hunger for or better cameras that increase picture taking from features that are neat but don’t get utilized []

Preview of the holiday quarter

Every October, at the end of its fiscal year, Apple files its Form 10K or annual report. In this report the company includes a section titled “Capital Assets” which details expenditures for capital equipment. This is last year’s entry:

The Company’s capital expenditures were $14.9 billion during 2017. The Company anticipates utilizing approximately $16.0 billion for capital expenditures during 2018, which includes product tooling and manufacturing process equipment; data centers; corporate facilities and infrastructure, including information systems hardware, software and enhancements; and retail store facilities.

Note that there are categories of spending detailed and that their order might indicate the degree of such spending, suggesting that product tooling and manufacturing equipment is likely to be the costliest category.

After this report, during subsequent quarters the company may update this forecast of spending. In the last (third fiscal) quarter the entry was as follows:

The Company’s capital expenditures were $11.1 billion during the first nine months of 2018 . The Company anticipates utilizing approximately $17.0 billion for capital expenditures during 2018, which includes product tooling and manufacturing process equipment; data centers; corporate facilities and infrastructure, including information systems hardware, software and enhancements; and retail store facilities.

Note that the forecast of $16.0 billion was updated to $17.0 billion and the first 9 months’ expenditures were $11.1. Since there is only one quarter remaining1 it’s reasonable to assume that the company’s forecasts are more likely to be precise and that therefore the difference between total expected spending and already spent, i.e.f $5.9 billion remains to be spent.

The actual spending is not recorded quarterly but an approximate value is reported in the Cash Flow statement as “Payments for acquisition of property, plant and equipment”. That can be tracked but it does not equal exactly the capital expenditure. For example, the quote above says expenditures were $11.1 billion through first 9 months but the total of all payments for acquisition of PP&E is $10.272 billion.

Minor2 differences, aside, this forecast and actual spending and payments data is significant because it is highly correlated to Apple’s overall business. Assuming that the spending on manufacturing equipment and information systems hardware (i.e. data centers) is in support of the iOS device sales and services we can try to show how sales correspond to spending with the following graph:

Here sales are shown as a bar graph and the various spending forecasts and actual payments are shown as lines. Also note that the spending and sales are offset by one quarter. The fiscal year is used for spending and the calendar year for sales. The reason is that spending is presumed to lead sales by approximately one quarter.

There are some notable discrepancies, especially with the 2012/2013 period when spending was brought forward a quarter thus showing a surplus to forecast in 2012 and a deficit in 2013. But apart from that, there is a broad correlation between spending and sales.

This means that the CapEx forecast in October is a good indicator of sales in the following year.

In fact, the relationship is can be shown with four scatter plots, one for each of the published figure:

I caution that this is a yearly forecast and it is revised through the year on a quarterly basis, sometimes up, sometimes down. It’s therefore not a perfect indicator and of course the relationship between sales and spending is not perfectly predictable. Note that there are four types of spending that can be measured, two are forecasts (one year and revised) and two are actuals (cash flow payments and reported total expenditures)

We can measure the best variable that fits the sales data through the coefficient of determination or R-squared. The best fit seems to be with Payments for acquisition of property, plant and equipment (R-squared of 0.976).

This gives the formula for yearly sales as 15.915x + 15809 where x is the expected total spending. That spending to date has been $10.272 billion and it’s probably going to exceed $16 billion for the year.

Using $16 billion spending total, we can calculate iOS products and services for calendar 2018 of $270.45 billion.

iOS and Services sales to date have been $103.2 billion with an estimate for next quarter of about 54.3 billion (based on guidance) and thus a total through Q3 of $157.5 billion. Subtracting this from the $270.45 billion expectation from the calculation above gives a fourth calendar quarter iOS revenue of $113 billion.

Adding $7 billion for the Mac results in a total net sales of 120billion. This therefore is what I’d put forward as a reasonable target for CQ4.

Note that this is equivalent to a growth of 36% from the 2017 fourth quarter.

[UPDATE: Original version used total sales rather than iOS related products and services (i.e. excluding Mac). The text has been edited to reflect the correct figures.]

  1. and since at the time the quarterly report is filed, only about 2 months remain in the quarter []
  2. To the extent that $1 billion can be considered minor []

Earnings Per Share

Three months ago Apple provided the following guidance:

As we move ahead into the June quarter,[…] We expect revenue to be between $51.5 billion and $53.5 billion. We expect gross margin to be between 38% and 38.5%. We expect OpEx to be between $7.7 billion and $7.8 billion. We expect OI&E to be about $400 million. And we expect our tax rate to be about 14.5%.

If we aim for a revenue figure close to the upper end of the range ($53.2 billion) and insert all the other figures (split the difference for OpEx) then then the company’s fiscal third quarter looks as follows:

Revenues: $53.2b
iPhone (units): 43.2 million
iPad (units): 11.6 million
Mac (units): 4.3 million
Services ($): 9.5 billion
Other products ($): 3.5 billion
Gross margin (%): 38.6%

EPS ($): $2.26

This last figure, the earnings per share, is the most speculative because it depends on another guidance that Apple gave: a new $100 billion share repurchase authorization and the fact that it has no time frame. For context, as of end of March the company had completed over $275 billion of its previous $300 billion capital return program and $10 billion remained for share re-purchases in the June quarter. It’s unclear how much of the new authorization will be spent in the quarter.

That spending could indicate the share count but there are issues with this calculation as well. The $2.26 EPS I forecast is based on the assumption that the the same number of shares will be retired as in the previous quarter (about 89 million shares.) However the company spent $23.5 billion on repurchases of 137 million Apple shares through open market transactions (for an average price or $171.53, in-line with the quarter’s trading average).

So why is the number of shares purchased (137 million) so different from the change in shares used to compute earnings per share (89 million)? I actually don’t know.

The question of how many shares are available to calculating EPS is perhaps the last mystery in what is otherwise a very predictable business. The revenue growth and implied iPhone growth are pretty transparent. Incidentally, the EPS I’m forecasting is equivalent to growth of 35.8% y/y. The share price is trading at multiples about half of this growth rate so it’s no wonder the company is spending most of the cash on re-purchases.

How quickly the $100 billion re-purchasing authorization will be used is another question. The effect in concentration of value per share could be profound as shown in the graph above which will have further implications on the “cash zero” direction for the company.


Determining The Average Apple Device Lifespan

In The Number I provided a model for estimating the number of active Apple devices at any point in time. The relationship between active devices and cumulative devices sold gives us a rule of thumb that says that 2 out of 3 devices ever sold are active.

I propose now that knowing active devices and cumulative devices sold allows one to determine the average device lifespan.

The following graph is a visual representation of how to obtain it:

Note that the second graph shows how the lifespan evolved over time.

Here’s how to compute this yourself: Visually, the lifespan is the distance horizontally between the two vertical bars such that the bars are the same length. The top vertical bar measures the gap between the area (cumulative devices) and the curve (active devices) and the lower bar is the gap between the area and the x-axis, i.e. the cumulative devices. When those two bars are the same size the distance between them is the lifespan (at the time of the top bar.)

Arithmetically, the average lifespan at a given time t is the duration between t and the moment when the cumulative devices sold reached the cumulative retired devices at time t.1

For example today–as the visual above represents–the lifespan is the time since cumulative devices sold reached the current total retired devices. The cumulative retired devices can be calculated as 2.05 billion cumulative sold minus 1.3 billion active or 750 million. The time when cumulative devices sold reached 750 million was the third quarter 2013. The lifespan is thus estimated at the time between now and Q3 2013 or 17 quarters or about 4 years and three months.

Note that cumulative devices sold includes Macs, iPhones, iPads, Apple Watches and iPod touch. Since (apart from the Watch2 ) this information is public, the only figure needed to determine lifespan at any time is active devices and that total is available through the logistic fit described in The Number.

In The Number I argued that active devices is a breakthrough in quantifying the value of Apple’s business. The first insight is into the size of device (read: user)  base, the second is in the resilience of that device base (2/3 in use). Now we see the third insight: the specific length of time or duration of use per device–a proxy for user satisfaction and loyalty. This I (and Deming) argue, is the most important measure of the health of a business because it speaks of the future and not, as all other figures do, the past.

I’ll show in the next post how this single number allows us to calculate the net present value of Apple’s future cash flows, or, by definition, Apple’s enterprise value.

  1. For a simulation and tabular explanation see below []
  2. Which I calculate to a satisfactory precision here []

Apple Remarks to Investors in FQ1 2018 Earnings Conference Call, Categorized and Annotated

The following is a transcript of the comments from Tim Cook (CEO) and Luca Maestri (CFO) at Apple’s Q1 2018 Earnings Conference Call February 1, 2018. I color coded my interpretation of the comments into four categories:

  • Grey: Background and promotional commentary
  • Red: Strategy and signals of what management considers important and may include data beyond the regularly reported numbers.
  • Green: Financial data
  • Black: Commentary.
  • Blue: My commentary, in brackets.

For a quick read of Apple’s strategy, read the Red text. These comments are not repeated in financial reports. Highly recommended.

For a quick read of Apple’s financial performance, read the green text (which are replicated in financial reports). Read this if you don’t want to wade through the financial reports.

For marketing or product material, read the grey text.This is sometimes unique but also repeats product launch information.

—-
Tim Cook:  Thanks, Nancy and thanks everyone on the call, and welcome to everyone today. Before we dive into the quarter, I’d like to take a moment to talk about a significant milestone we recently crossed.

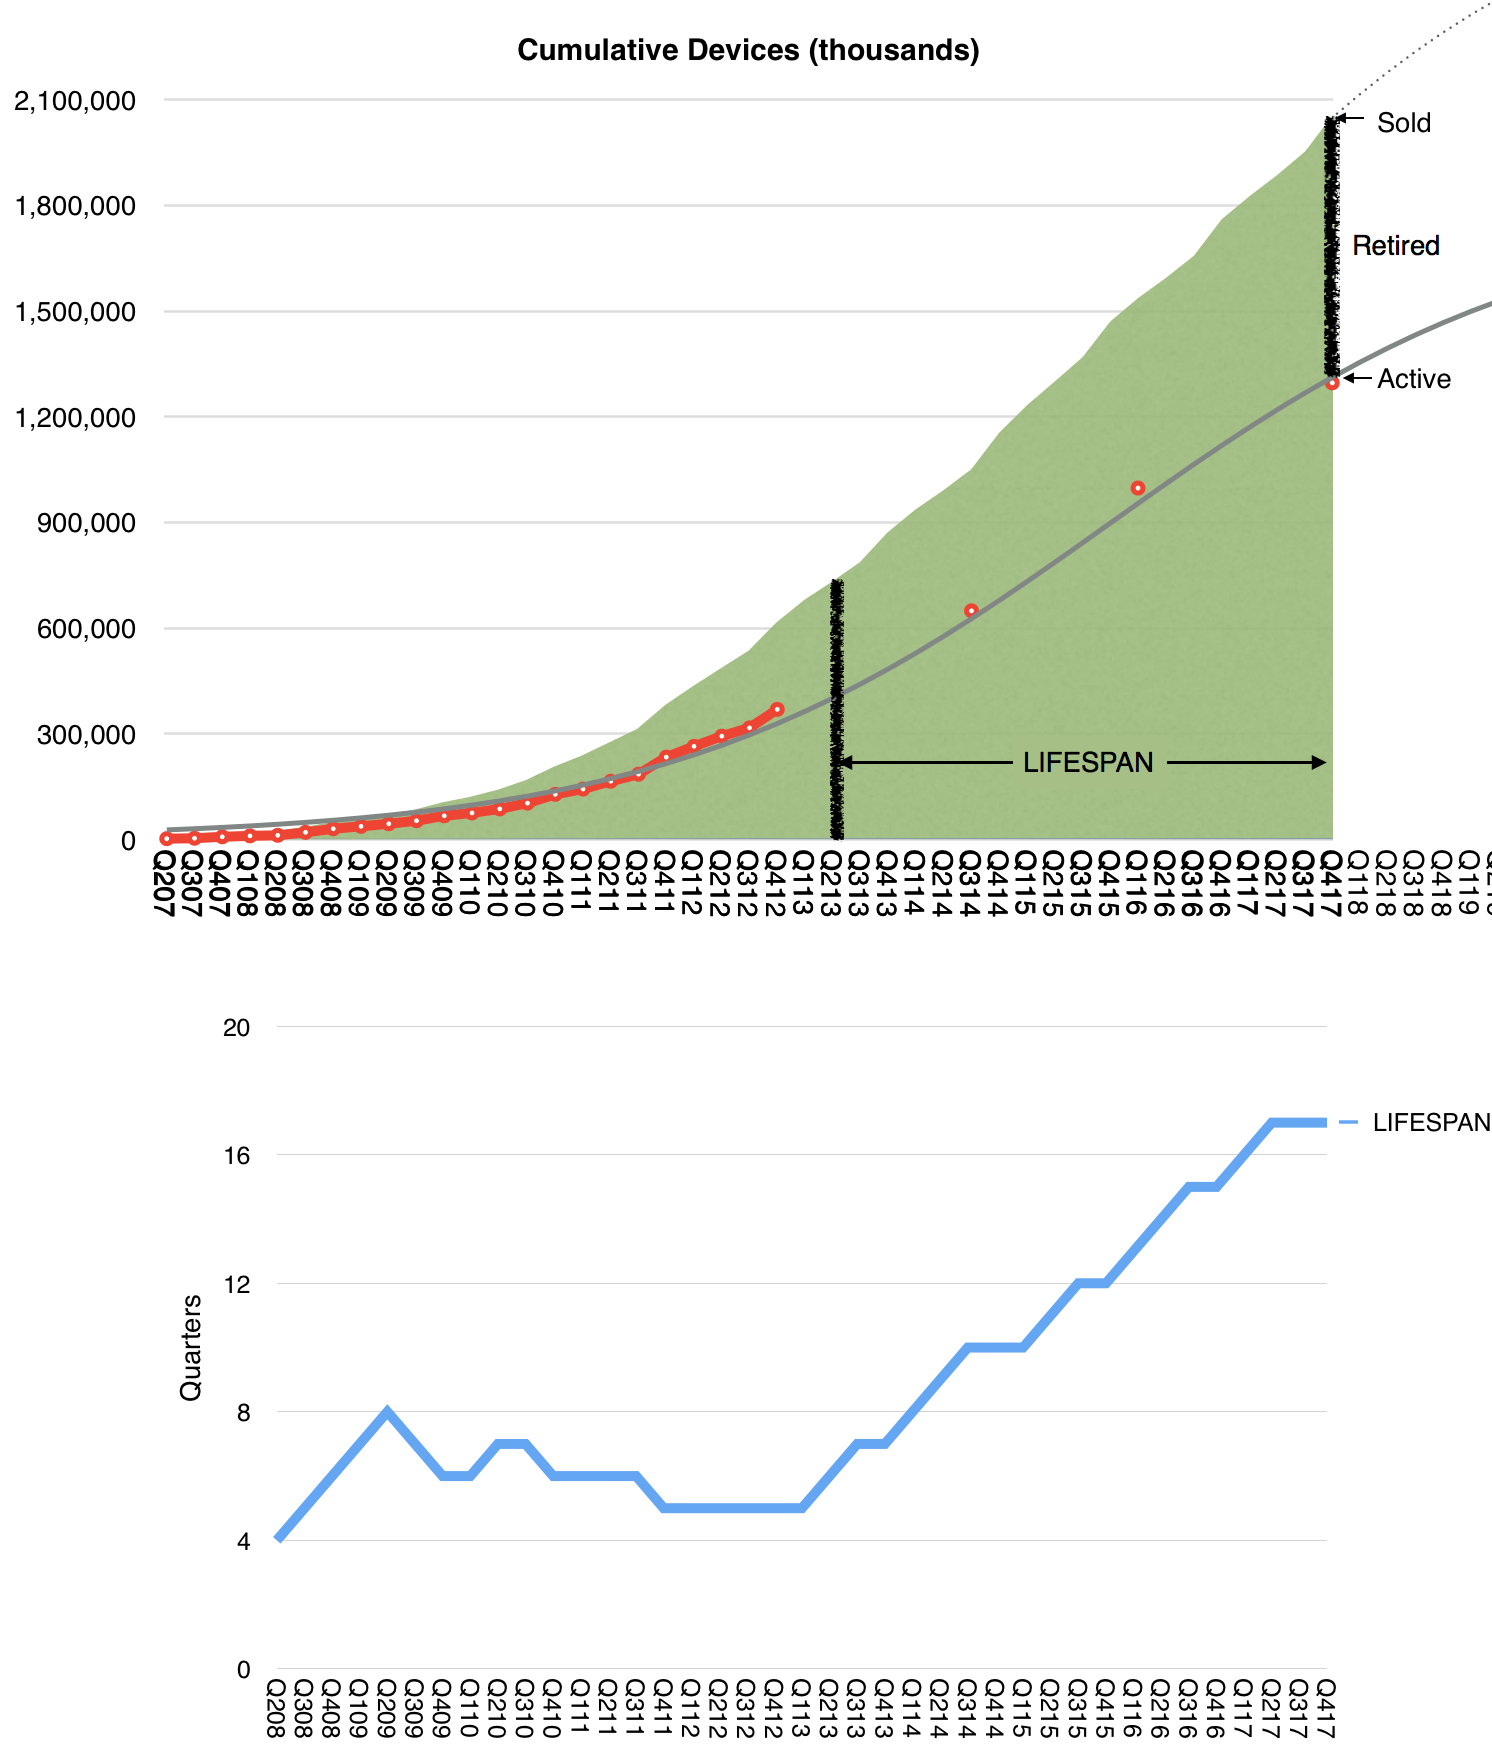
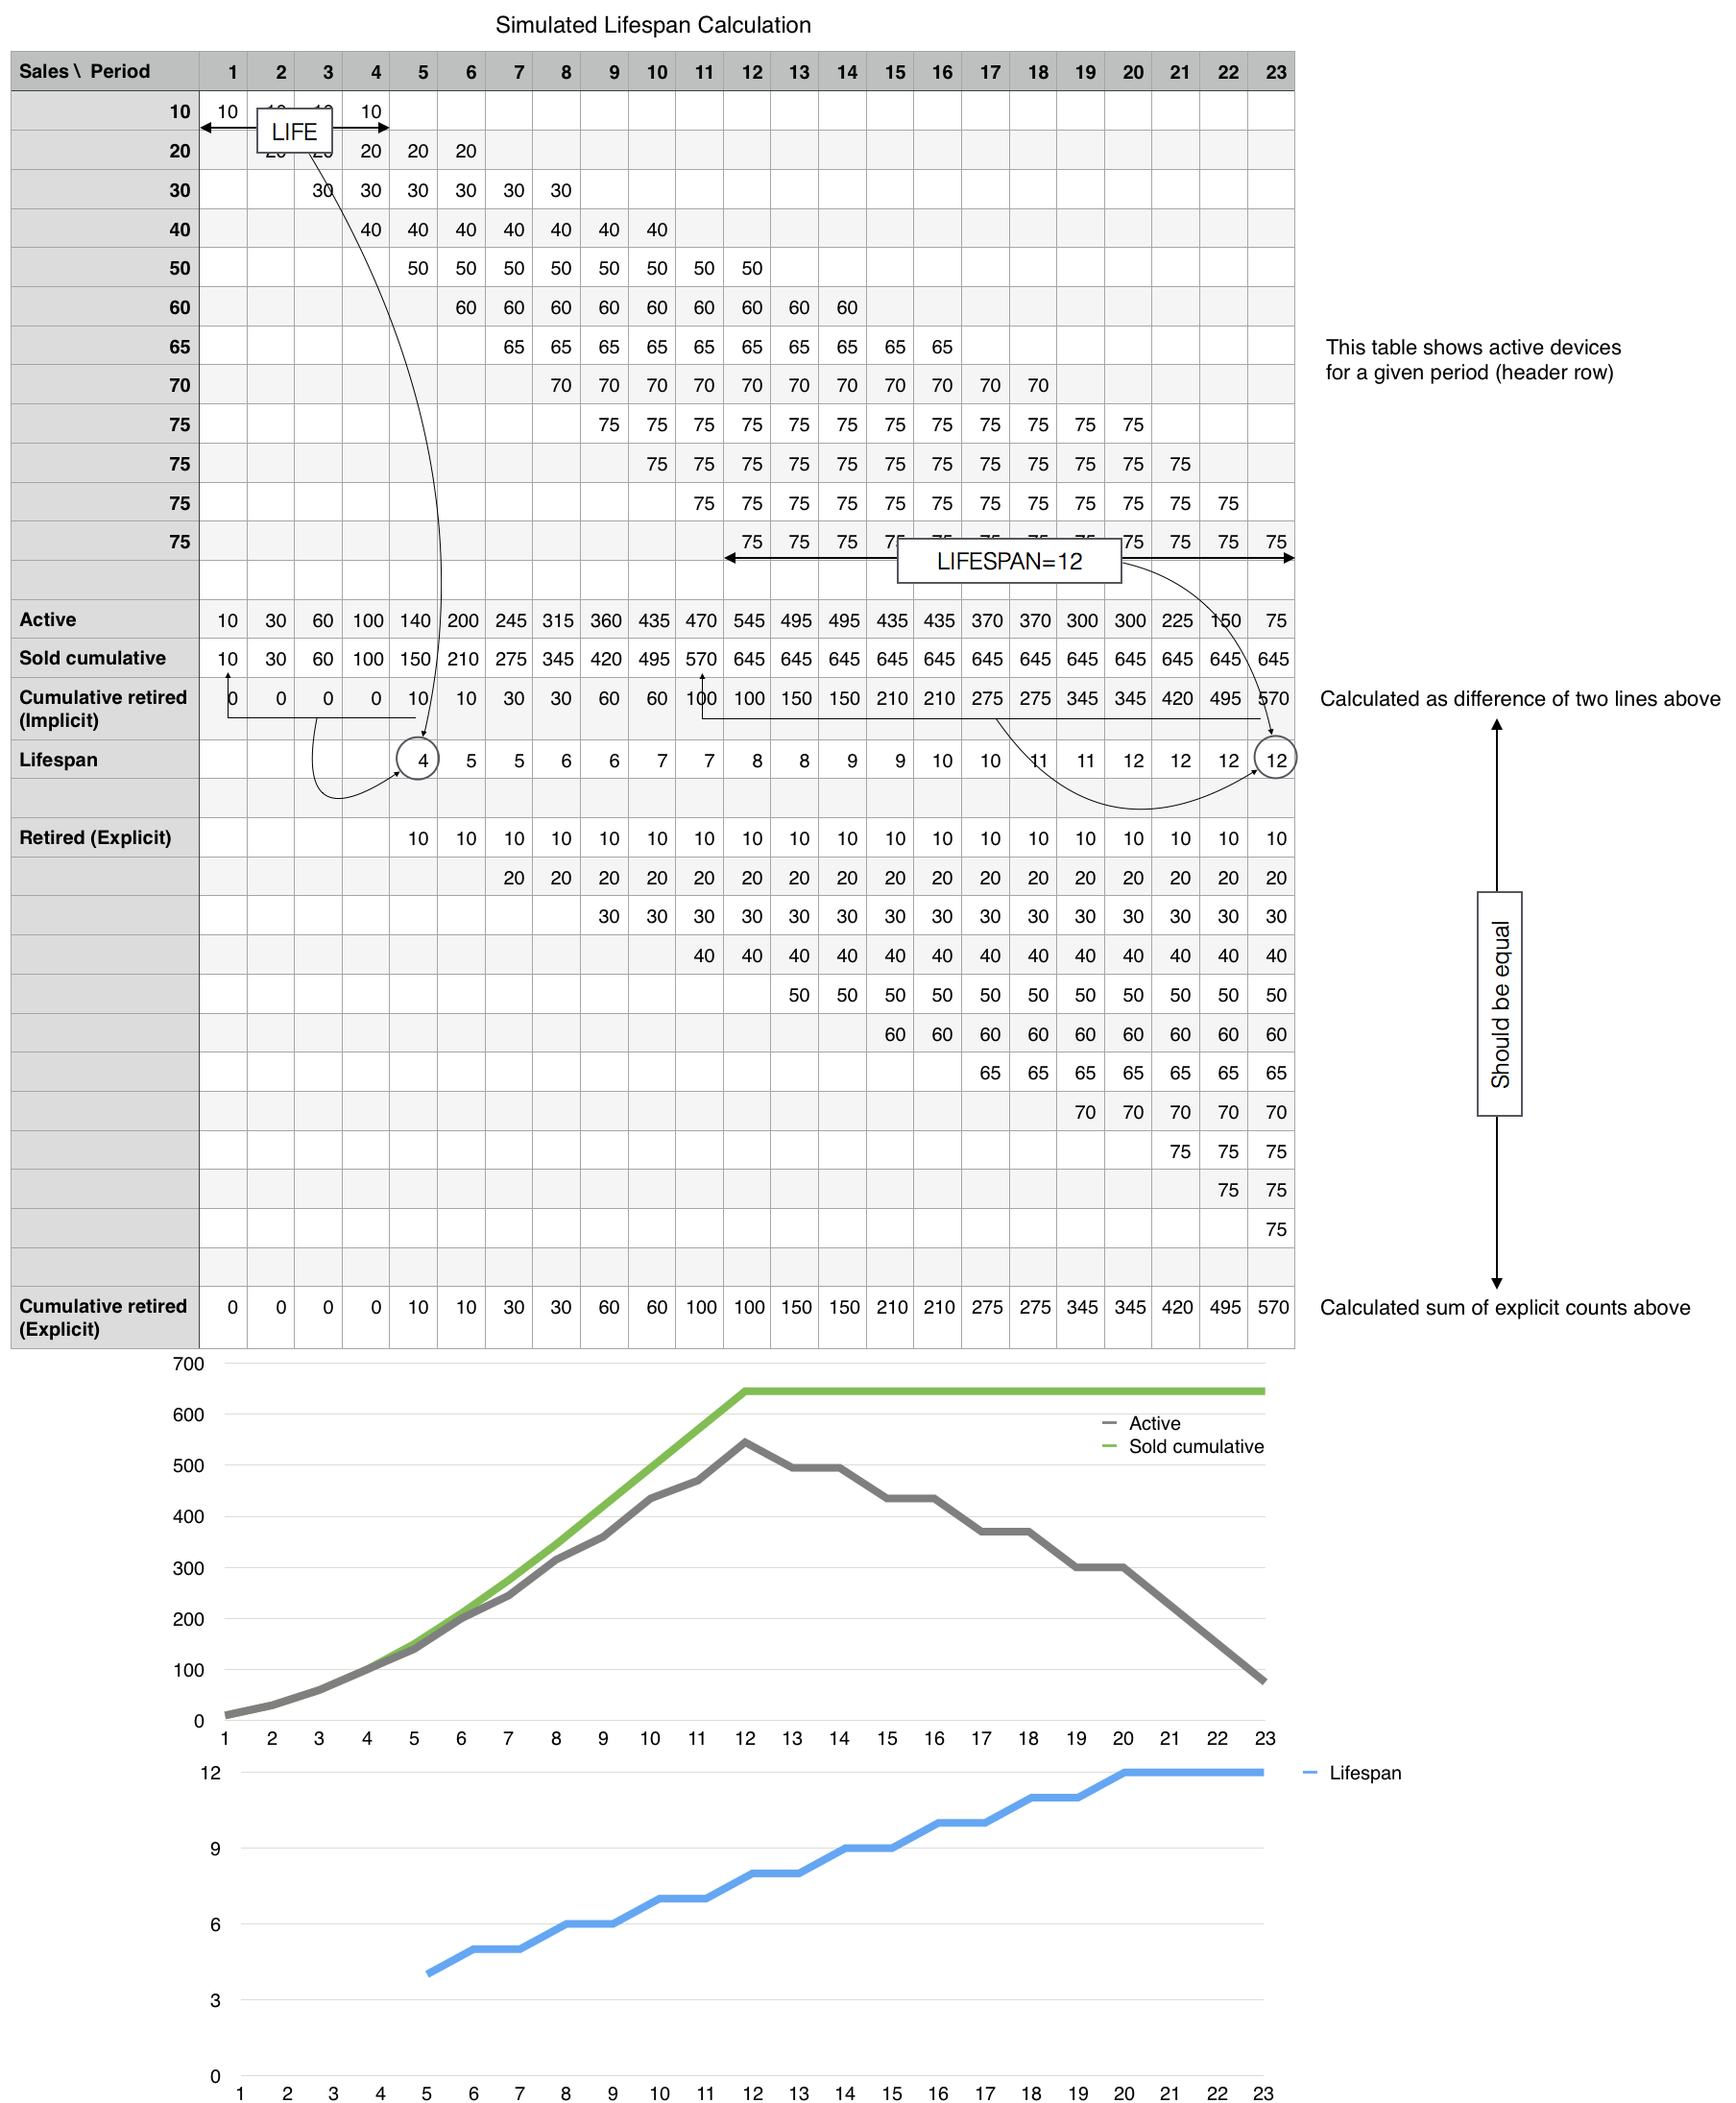
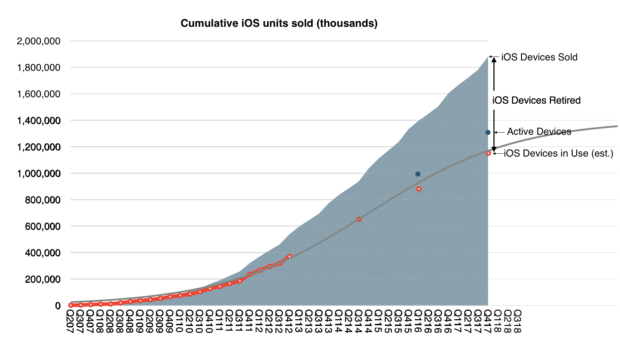
Apple’s active installed base reached 1.3 billion devices in January and is at an all-time high for all of our major products. 1.3 billion devices represents an astonishing 30% growth in just two years. It speaks to the strength and reliability of our products and our ecosystem, as well as the loyalty, satisfaction and engagement of our customers. It’s also fueling tremendous growth in our services business, which I’ll talk about a little later in the call. [This is probably Apple’s most important number. For at least the next 20 years this is the key performance metric and it can be used to derive company’s valuation. A summary of the history of active devices vs. units sold is shown in the graph below:]

Turning to the December quarter. We’re thrilled to report Apple’s biggest quarter ever, which set new all-time records in both revenue and earnings. We generated revenue of $88.3 billion, which is above the high-end of our guidance range, and it is up almost $10 billion or 13% over the previous all-time record we set a year ago.

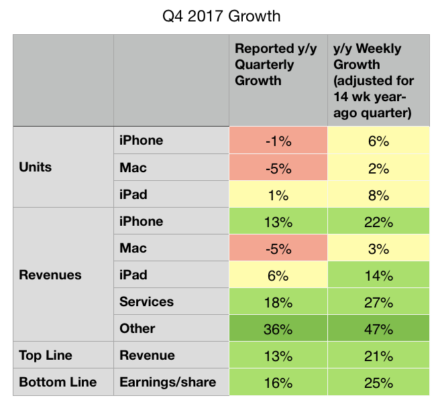
It’s also our fifth consecutive quarter of accelerating revenue growth with double digit growth in each of our geographic segments around the world. What makes us even more remarkable is that the quarter we’re reporting today was 13-weeks long, while the year ago quarter was 14-weeks. When we look at the average revenue per week in the December quarter this year compared to last year, our growth was a stunning 21%. [The 13-week vs. 14-week year-on-year comparison is repeated several times. The summary differences are shown in the table below:] 

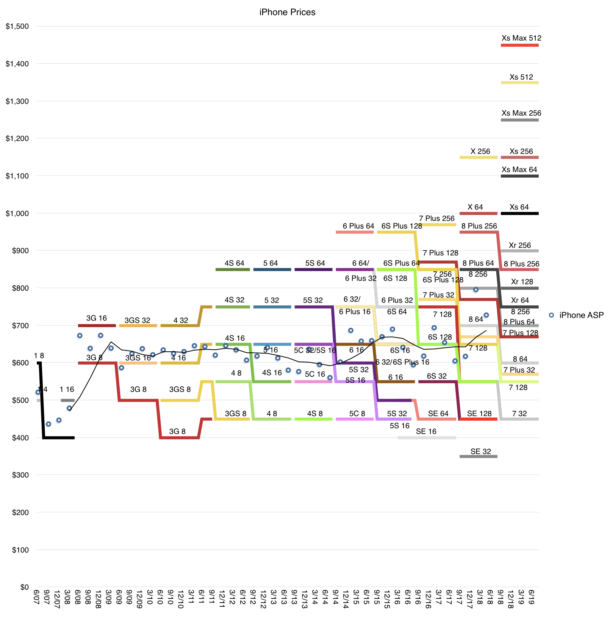
Our growth was broad-based and a key driver was iPhone, which generated its highest revenue ever. iPhone X was the best-selling smartphone in the world in the December quarter according to Canalys, and it has been our top selling phone every week since it launched. iPhone 8 and iPhone 8 Plus rounded out the top three iPhones in the quarter. In fact, revenue for our newly launched iPhones was the highest of any lineup in our history, driving total Apple revenue above our guidance range. [The iPhone X is a huge hit. It drove the average selling price $100 higher y/y. This is not only unprecedented for Apple but for the entire Industry. The average smartphone sells for less than $300 while iPhones sold for $800. The gap is widening. The following graph shows the product mix and the average resulting price.] 

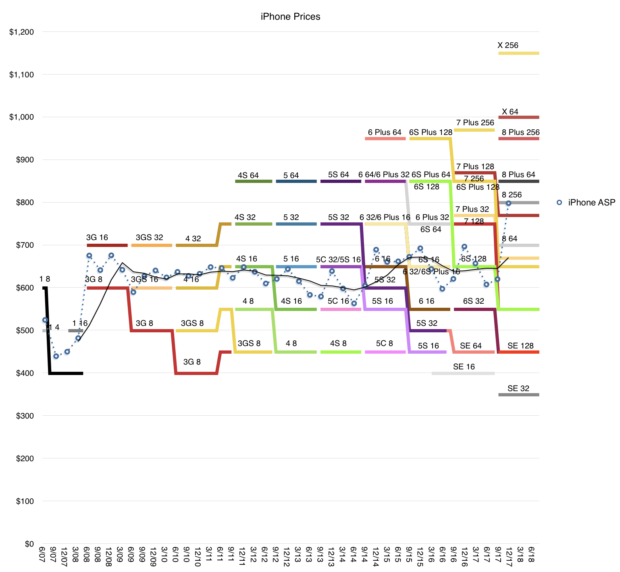
I want to take a moment to recognize the tremendous amount of work that went into creating iPhone 10. Our teams carried out an extremely complex launch from both an engineering and operations perspective, executing an outstanding product ramp that required years of research and development; one that introduced innovative features like an edge-to-edge Super Retina Display and the TrueDepth Camera, which enables face ID. Our customers love these new features and the new gestures like simply swiping up from the bottom, which make using iPhone even more intuitive and enjoyable.

Our team has put the technology of tomorrow in our customers’ hands today, set a standard for the next decade of smartphones and we are very proud of their achievements.

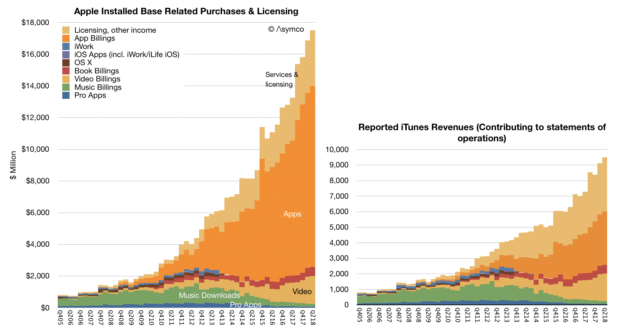
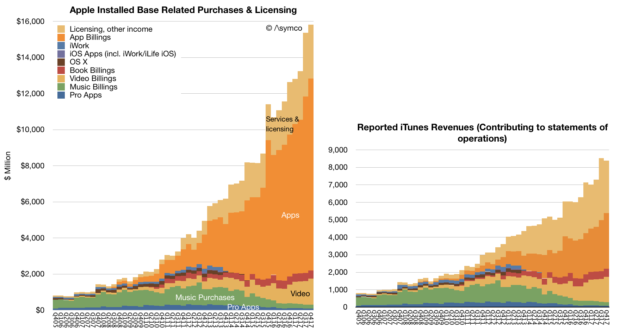
It was another very strong quarter for services with revenue of $8.5 billion, up 18% over last year, and we’re on pace to achieve our goal of doubling our 2016 services revenue by 2020. The number of paid subscriptions across our services offerings passed 240 million by the end of the December quarter, that’s an increase of 30 million in the last 90 days alone, which is the largest quarterly growth ever. [Services has been growing relentlessly for over a decade. This steadiness of growth makes is a juggernaut. Apple is increasingly speaking about subscriptions as the key metric and 240 million is reaching record territory. The rise of Services is shown below (both revenues and consumer spending.)]


We had an all-time record quarter for the App Store with our best holiday season ever. We’re seeing great excitement around augmented reality with customers now enjoying over 2,000 ARKit enabled app, spanning every category in the App Store. In December, when Pokémon GO released its new augmented reality features built with ARKit, it jumped the top of the App Store charts. Last week, on a stop in Toronto, I met developers who are hard at work on creative applications using ARKit from art appreciation to ecommerce, and I was very impressed with what I saw.

Just for months after ARKit launched to the public, we’ve already released ARKit 1.5 in beta to developers around the world, and the response has been tremendous. Augmented reality is going to revolutionize many of the experiences we have with mobile devices. And with ARKit, we’re giving developers the most advanced tools on the market to create apps for the most advanced operating system running on the most advanced hardware. This is something only Apple can do.

In addition to the App Store, several other services had their biggest quarter ever, including Apple Music, iCloud and Apple Pay, all of which saw growth in both active users and revenue.

Apple Pay has reached an important milestone in the U.S. As a result of 50% year-over-year growth in merchant adoption, it’s now accepted at more than half of all American retail locations, which includes more than two-thirds of the country’s top 100 retailers. Now available in 20 markets, global Apple Pay purchase volume more than tripled year-over-year and we’re delighted to be expanding to Brazil in the coming months. [There are no absolute data points on Apple Pay but we do have some scattered growth data. The US data is cited here but in my experience it’s more popular in select countries like UK where users are using it habitually]

Today, you can use Apple Pay to take the subway in Guangzhou, China, see a concert at London’s Wembley Stadium or buy a souvenir in Yosemite National Park. In the U.S., we launched Apple Pay Cash in December, and it’s off to a terrific start. Millions of people are already using it to send and receive money with friends and family quickly, easily and securely; to split a bill, pay someone back, or send last minute gift right from the messages app.

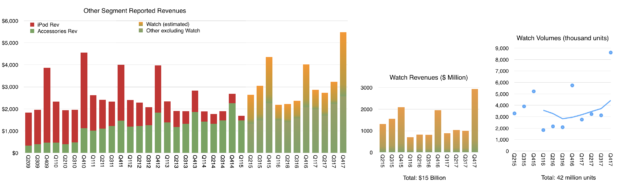
It was our best quarter ever for the Apple Watch with over 50% growth in revenue and units for the fourth quarter in a row and strong double-digit growth in every geographic segment. Sales of Apple Watch Series 3 models were also more than twice the volume of Series 2 a year ago. Apple Watch is the most popular, smart watch in the world and gained market share during the quarter based on the latest estimates from IDC. [Apple Watch is growing consistently. The following graph shows my estimates of volume (total 42 million to date) and revenues (total $15 billion) based on all available data and commentary from management.]

It was the third consecutive quarter of growth for iPad revenue, thanks to the strength of both iPad and iPad Pro. Based on the latest data from IDC, we gained share in nearly every market we track with strong outperformance in emerging markets.

Worldwide, almost half of our iPad sales were the first-time tablet buyers are those switching to Apple, and that’s true in some of our most developed markets, including Japan and France. In China, new and switching users made up over 70% of all iPad sales.

For Mac, we launched the all new, iMac Pro in mid-December. It’s an entirely new product line designed for our Pro users who love the all-in-one design of iMac and require workstation class performance. It’s the fastest, most powerful Mac ever, delivering incredible computational power, for simulation and real time 3D rendering, immersive VR and complex photography audio and video projects. Worldwide, 60% of our Mac sales were the first time buyers and switchers and in China, that number was almost 90%.

We’re looking forward to getting HomePod in customers’ hands beginning next week. HomePod is an innovative wireless speaker, which delivers stunning audio quality wherever its placed in the home, thanks to the advanced Apple engineered hardware and software.

Together with Apple Music, HomePod gives you instant access to one of the world’s largest music catalogs. And with the intelligence of Siri, it’s a powerful assistant you control through natural voice interaction. We’re very happy with the initial response from reviewers who’ve experienced HomePod ahead of its launch, and we think our customers are going to love this new product.

We believe one of the key issues of the 21st century is education. And because of that, we’ve strengthened our commitment and investment into initiatives like everyone can code. To find the innovators of the future, we need to nurture the students of today. Our App Development with Swift curriculum, which is available free on iBooks, has been downloaded more than 1.2 million times worldwide with almost half of those coming from here in the United States. It’s also being taught in dozens of community colleges across the country, putting practical skills in the hands of today’s jobs seekers.

I was in London two weeks ago as we announced that the program was expanding to more than 70 colleges and universities in Europe. Millions of students around the world will have the opportunity to add Swift to their coding vocabulary and gain skills that are essential for today’s economy.

This is an exciting time at Apple and with the best lineup of products and services we’ve ever had and a set of initiatives that show how business can be a force for good in the world. We could not be more excited about our future.

Now, for more details on the December quarter results, I’d like to turn over the call to Luca.

Luca Maestri: Thank you, Tim. Good afternoon, everyone. Our business and financial performance in the December quarter were exceptional, as we set new all-time records for revenue, operating income, net income and earnings per share.

Starting with revenue, we’re reporting an all-time record, $88.3 billion, up nearly $10 billion or 13% over the prior record set last year. It is our fifth consecutive quarter of accelerating revenue growth. As you know, the December quarter a year ago spanned 14-weeks compared to 13-weeks this year, which is important to consider as we have set the underlying performance of our business this year. When we look at average revenue per week, our growth rate was even higher at 21% with growth across all product categories for the third consecutive quarter.

Our results were terrific all around the world with double digit revenue growth in all our geographic segments, an all-time quarterly record in the vast majority of markets we track, including the U.S., Western Europe, Japan, Canada, Australia and Korea, as well as Mainland China, Latin America, The Middle East, Central and Eastern Europe, and India.

In Greater China, we were very happy to generate double digit revenue growth for the second quarter in a row and in emerging markets outside of Greater China, we saw 25% year-over-year growth.

Gross margin was 38.4% at the high end of our guidance range. Operating margin was 29.8% of revenue. Our net income was $20.1 billion an all-time record, and up $2.2 billion over the last year. Diluted earnings per share were $3.89 also an all-time record and cash flow from operations was very strong at $28.3 billion.

During the quarter, we sold 77.3 million iPhones, the highest number ever for a 13-week quarter. Average weekly iPhone sales were up 6% compared to December quarter last year with growth in every region of the world despite the staggered launch of iPhone 10. We established all-time iPhone revenue record in nearly every market we track with double-digit growth in all of our geographic segments. iPhone ASP increased to $796 from $695 a year ago, driven primarily by the launch of iPhone 10 and the success of iPhone 8 and 8 Plus.

We exited the December quarter towards the lower end of our target range of five to seven weeks of iPhone channel inventory with less than 1 million more iPhones in the channel compared to the December quarter a year ago, in line with our growth in average weekly unit sales. Customer interest and satisfaction with iPhone are very, very strong for both consumers and business users.

The latest data from 451 Research indicates U.S. customer satisfaction ratings of 96% or higher across iPhone models. In fact, combining iPhone 8, iPhone 8 Plus and iPhone 10, consumers reported an amazing 99% satisfaction rating. And among business customers planning to purchase smartphones in the next quarter, 77% planned to purchase iPhone. Our customers are also incredibly loyal with Kantar’s latest U.S. research, reflecting a 96% iPhone loyalty rate, the highest ever measured. [Customer satisfaction is the second most important figure after active user base. Combining these two figures yields the recurring revenue value of the company. Remember what Deming said: the most important measurements for a company’s value are the multipliers of a satisfied customer and a dissatisfied customer–these numbers never appear on any financial report but they are applied to all the numbers on every report].

Turning to services. We had a terrific quarter with revenue of $8.5 billion, up 18% year-over-year and up 27% in terms of average revenue per week; that is an acceleration to the 24% services growth run rate that we experienced in the September quarter.

The App Store set a new all-time revenue record. The Store’s all-new design is off to a fantastic start with quarterly store visitors, transacting accounts and paying accounts, reaching new all-time highs. During the week beginning December 24th, a record number of customers made purchases or downloaded Apps from the App Store, spending over $890 million in that seven-day period, followed by $300 million in purchases on New Year’s day alone.

And according to App Annie’s latest report, the App Store continues to be the preferred destination for customer purchases by a very wide margin, generating nearly twice the revenue of Google Play. Across all our services offerings, paid subscriptions reached $240 million with growth of 58% over last year and they were a major contributor to the overall strong growth in services revenue[Apple has half the user base of Google Android. This is based on Google’s May 2017 report of 2 billion active devices vs. the 1.3 billion that we just got from Apple. And yet these users collectively spend twice as much on apps. This ratio of “half the users, twice the spending” has been cropping up in individual developer anecdotes and can also be seen in other metrics of engagement and consumption. This should not be surprising as it conforms to the Pareto distribution of economic value.]

As Tim mentioned, it was our best quarter ever for Apple Watch. And when we add to this us from Beats and AirPods, our total revenue from wearables was up almost 70% year-over-year. In fact, wearables were the second largest contributor to revenue growth after iPhone, which is impressive for a business that started only three years ago. In total, our other products category set a new all-time record with quarterly revenue exceeding $5 billion for the first time[Wearables now includes more than watches but watches are likely still the dominant product.]

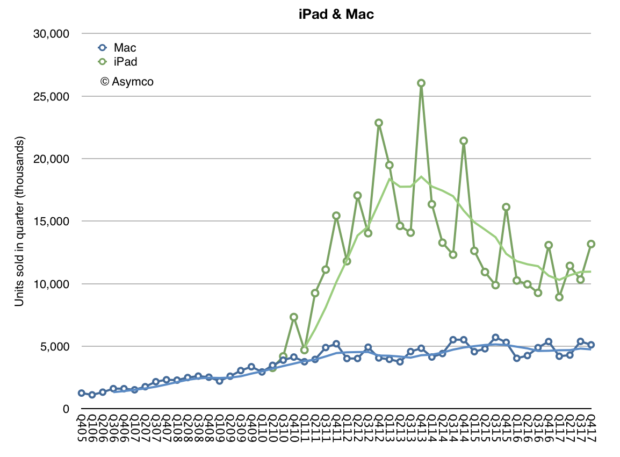
Next, I’d like to talk about the Mac. We sold 5.1 million Macs during the December quarter, which translates to a 2% year-over-year increase in average sales per week. Mac performance was particularly strong in emerging markets with unit sales up 13% year-over-year and with all-time records in Latin America, in India, Turkey and Central and Eastern Europe. On a worldwide basis, the active install base of Macs was up double-digits year-over-year to a new record.

It was also another growth quarter for iPad. We sold 13.2 million units with average iPad sales per week up 8% over last year’s December quarter. iPad sales grew strong double-digits in many emerging markets, including Latin America, the Middle East, Central and Eastern Europe and India, as well as developed markets, including Japan, Australia and Korea. The active install base of iPad has grown every quarter since its launch in 2010, and it reached a new all-time high in December, thanks to extremely high customer loyalty and large numbers of first-time iPad users. [iPad is clearly recovering from a long decline. ASPs are rising as it’s being positioned as a PC alternative. Its low end functions are being absorbed by large screen iPhones.]

NPD indicates that iPad had 46% share of the U.S. tablet market in the December quarter, up from 36% share a year ago. And the most recent surveys from 451 Research found that among customers planning to purchase tablets within 90 days, 72% of consumers and 68% of business users planned to purchase iPads. Customer satisfaction is also very high with businesses reporting a 99% satisfaction rating for iPad.

We are seeing great traction in enterprise as businesses across industries and around the world standardize on iOS. For example, Intesa Sanpaolo, one of Europe’s leading banks, has chosen iOS as the mobile standard for its entire 70,000 employee base in Italy; choosing iOS for its security, user interface, accessibility and reliability, Intesa Sanpaolo will deploy native apps to improve employee productivity in customer support, human resources, and marketing across the company.

And LensCrafters, one of the largest optical retail brands in North America, will be using over 7,000 iPad Pros to enable digital eye exams and digital optical measurements in a personalized and interactive experience. We’re also rolling out a new initiative, called Apple AtWork to help businesses implement employee choice programs more easily and offer Apple products company-wide.

Resources from both Apple and our channel partners will enable enterprise IT and procurement teams to buy or lease Apple products more efficiently, streamline the setup of iPhone, iPad, and Mac, and deliver a seamless onboarding experience for employees. We launched the program with CDW in the U.S. last week, and we would be expanding to more channels and regions later this year.

The December quarter was extremely busy for our retail and online stores, which welcomed 538 million visitors. Traffic was particularly strong during the four-weeks following the launch of iPhone 10, up 46% over last year. And across the quarter, our stores conducted over 200,000 today at Apple sessions, covering topics including photography, music, gaming, and app development, and art and design. Just last weekend, we opened our first store in Seoul, Korea and we’re looking forward to opening our first store in Austria in a few weeks. These newest openings will mark the expansion of our retail store presence to 21 countries.

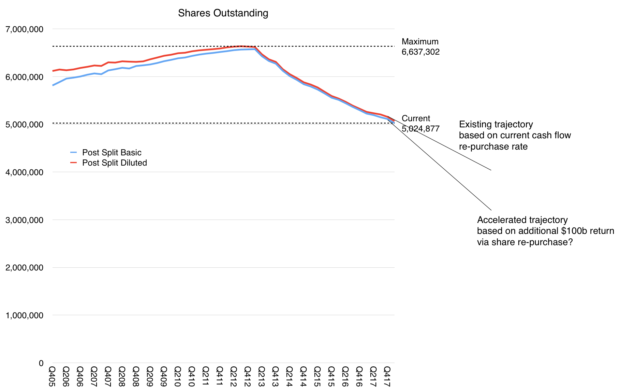
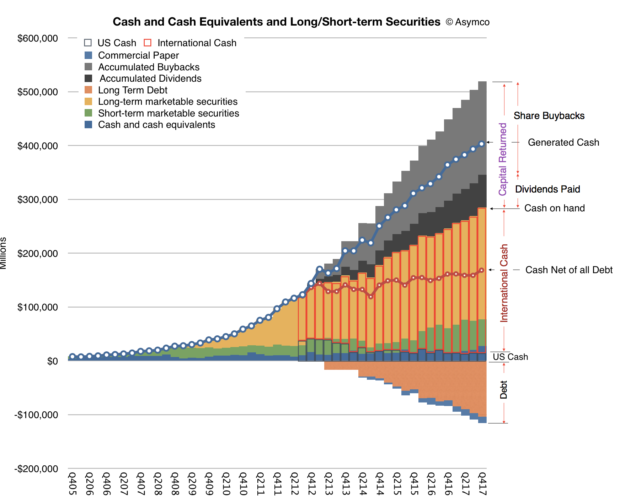
Let me now turn to our cash position. We ended the quarter with $285.1 billion in cash plus marketable securities, a sequential increase of $16.2 billion. $269 billion of this cash, or 94% of the total, was outside the United States. We issued $7 billion in debt during the quarter, bringing us to $110 billion in term-debt and $12 billion in commercial paper outstanding, for a total net cash position of $163 billion at the end of the quarter. We also returned $14.5 billion to investors during the quarter. We paid $3.3 billion in dividends and equivalents, and spent $5.1 billion on repurchases of 30.2 million Apple shares through open market transactions.

We launched a new $5 billion ASR program, resulting in initial delivery and retirement of 23.6 million shares and we retired 3.8 million shares upon the completion of our 12th ASR during the quarter. We’ve now completed over $248 billion of our $300 billion capital return program, including $176 billion in share repurchases against our announced $210 billion buyback program with $34 billion remaining under our current authorization[An updated look at Apple’s cash is shown below]

Turning to taxes. Due to the recently enacted legislation in the U.S., we estimate making a corporate income tax payment of approximately $38 billion to the U.S. government on our cumulative past foreign earnings. This amount is very similar to what we had been accruing on those earnings in our financial results through fiscal year 2017, including the $38 billion payment. We will have paid over $110 billion of corporate income tax on our total domestic and foreign earnings during the last 10 years for a cash tax rate of about 26%. [Apple has paid more tax than any company in history, and is about the make the largest single payment to the US Treasury.]
Our tax rate of 25.8% for the December quarter was close to our guidance of 25.5% as the lower U.S. statutory rate from the new legislation was effective offset by the remeasurement of deferred tax balances.

As we move ahead into the March quarter, I’d like to review our outlook, which includes the types of forward looking information that Nancy referred to at the beginning of the call; we expect revenue to be between $60 billion and $62 billion; we expect gross margin to be between 38% and 38.5%; we expect OpEx to be between $7.6 billion and $7.7 billion; we expect OI&E to be about $300 million; and we expect the tax rate to be about 15%.

Tax reform will allow us to pursue a more optimal capital structure for our company. Our current net cash position is $163 billion. And given the increased financial and operational flexibility from the access to our foreign cash, we are targeting to become approximately net cash neutral overtime. We will provide an update to our specific capital allocation plans when we report results for our second fiscal quarter, consistent with the timing of updates that we have provided in the past.

Finally, today our Board of Directors has declared a cash dividend of $0.63 per share of common stock, payable on February 15, 2018, to shareholders of record as of February 12, 2018.

Predicting The Second Quarter

The last quarter of 2016 was Apple’s biggest ever. $78.4 billion in revenues. 78.3 million iPhones. Both records. Earnings of $3.361 and cash reached new highs. The growth was modest but Services is now not just the second largest revenue but also the fastest growing, on track to doubling in four years.

The reason for this is the vastness of Apple’s user base coupled with the loyalty the brand engenders. The company reached one billion active devices more than a year ago and is quite likely to have nearly a billion users. Not just any billion either–the best billion most probably.

The realization that Apple benefits from extreme quantity and quality of customers has led some observers to defer the imminence of Apple’s demise. Share prices have risen lately to new highs and the ratios between these prices and earnings have started to come closer to the average of other large companies.

But enough with the reductio ad absurdum. Let’s look at the next quarter. The company has been very precise with its own offered predictions (guidance) so it’s a simple task to make an accurate forecast. The history of guidance vs. outcomes for revenues is shown below:

Placing the pipper on the upper edge of the guidance range was a safe targeting method for 11 of the last 17 quarters. We have never seen a drop below the bottom of the range but had a few overshoots, some huge. Doing this for the latest quarter and working backwards to the individual product contributions to revenue and using historical margin and cost patterns we can get the following core financial performance metrics:

Fiscal Q2 2017:
Rev ($B) 53.4
EPS ($/share) 1.96
iPhone (thousand units) 53100
iPad (thousand units) 9900
Mac (thousand units) 4100
Watch (thousand units) 2300
Services ($ million) 7129
Other products ($ million) 2300
Gross margin (%) 37.8

I sent these estimates to Philip-Elmer DeWitt and I recommend looking at his survey of the other analyst estimates on his excellent Apple 3.0 blog.

Overall, the quarter is shaping up to offer slight growth y/y and indicating a plateau formed after the surge from the iPhone 6 surge in ’15. All eyes are on the “super cycle” for the next iPhone.

The reason it’s “super” is that the iPhone has a 2+ year cadence for form factor changes and the user base updates on a similar cycle. The demand is vast due to the user base and accumulated age of devices in use. Expectations are that supply will be offered to meet this demand.

If history is a guide then the next iPhone will be the best iPhone ever.


  1. On shares priced at the time around $105 or 3.2% yield quarterly earnings []

The First Trillion Dollars is Always the Hardest

In its first 10 years, the iPhone will have sold at least 1.2 billion units,1 making it the most successful product of all time. The iPhone also enabled the iOS empire which includes the iPod touch, the iPad, the Apple Watch and Apple TV whose combined total unit sales will reach 1.75 billion units over 10 years. This total is likely to top 2 billion units by the end of 2018.

Screen Shot 2017-01-11 at 10.15.00 PM

The revenues from iOS product sales will reach $980 billion by middle of this year. In addition to hardware Apple also books iOS services revenues (including content) which have totaled more than $100 billion to date.

This means that iOS will have generated over $1 trillion in revenues for Apple sometime this year.

In addition, developers building apps for iOS have been paid $60 billion. The rate of payments has now reached $20 billion/yr.

screen-shot-2017-01-11-at-9-41-29-pm

Not included in this payment total are “mobile-first” or “mobile mainly” businesses such as FaceBook, Twitter, Linkedin, Tencent, YouTube, Yahoo, NetEase, Pandora Radio, Google Search, Baidu, Google Maps, Gmail, Instagram, Amazon, eBay, JD.com, Alibaba, Priceline, Expedia, Salesforce and Other Enterprise Software, Ride Sharing Apps, AirBnB and many other services which monetize independently of the App Store.

I estimate that the cumulative revenues enabled by iOS across these businesses have exceeded $500 billion, with a rate of revenue soon to reach $300 billion/yr.

The revenue numbers can only hint at the change in behavior among users. An iPhone is unlocked 80 times a day. Assuming 600 million devices in use there are 48 billion sessions on iPhones every day. 17.5 trillion sessions every year. It is these instances of interaction and engagement which are desired by all businesses built on top of the ecosystem.

These instances of engagement must be multiplied by the quality of the customers which Apple captures. iOS users spend more and are more loyal than those on alternative platform thus qualifying the platform as “premium” and thus adding to its value in the eyes of developers, content producers and service providers.

As the install base of iOS increases and as users hire the devices to do more and spend more time with them the virtuous cycle of value creation will continue and accelerate.

There is a temptation to think that such a business is fragile and will be disrupted. Challengers appear daily and the number of iPhone “killers” is not measurable. One can cite the billion users of Nokia phones which defected. One can cite the loyalty of BlackBerry users that evaporated. One can even cite the juggernaut of Windows and how it became impotent. One can cite the vast number of Android devices offered at low prices.

But there are reasons to believe that the iOS empire is far stronger and resilient.

Unlike Nokia’s phones, Apple’s product is an ecosystem with network effects and dependencies on software and services. It’s also a monolithic product with a singular interface and form factor.

Unlike BlackBerry, the iPhone does many jobs–too many to count. Indeed the iPhone evolves and changes its core value over time.

Although different in many ways from Windows there are strong similarities in terms of loyalty and persistence of users. iOS even developed a dominant position in enterprises. Microsoft’s attempt to become a hardware company is a testament to the confluence of the two business models.

And whereas Android was originally seen as the “good enough” iPhone, potentially disrupting it, it turns out to be the ersatz iPhone. Chances are higher that users will switch from Android to iPhone and not the other way. Again, the reasons have more to do with the ecosystem and quality of users (which are hard to measure) than with the hardware (which is easy to measure.)

As we look toward the second decade of the iPhone, the expectation isn’t one of another “big bang” but a process of continuous improvement. The market is nearing saturation so the goals must be to capture more switchers from Android. Apple has achieved this with the Mac: survival, persistence and eventual redemption.

More exciting is the apparent expansion of a network of ancillary “smart” accessories. The Apple Watch, the AirPods, Pencil and possible new wearables point toward a future where the iPhone is a hub to a mesh of personal devices. The seamless integration of such devices is what has always set Apple apart.


  1. Includes forecast for first six months of 2017 []

Post-keynote Apple event San Francisco – September 8


I will be presenting my latest analysis of Apple at the Sustain event in San Francisco on Thursday Sept 8th, the day after Apple’s keynote, along with Ben Bajarin, Carolina Milanesi who will alsob equipped with their latest market insights.

sustain-title-white

There is a time to disrupt and there is a time to sustain.

Sustain event is about understanding Apple’s levers of control to sustain the iPhone as it moves into direct competition with Android. We will also examine positions of top five technology brands: Apple, Amazon, Facebook, Google, and Microsoft.

Learn more about the event at Airshow.io. Given he short notice, we are keeping this event on the small side so reserve your seat soon.

Dialogue with Sviatoslav Rosov for CFA Institute Magazine


Why is an expert on disruptive technology “worried” about financial innovation?


Excerpt from “Chaos Is Hard to Predict”

Does technical innovation always end in displacement/ replacement?
The professions being challenged include physicians, lawyers, consultants, and analysts. Algorithms and sensors could conceivably displace some subset. However, it’s not a certainty. One way to fend off automation displacement is to redefine and change the scope of the profession.

The classic example is from the birth of the Industrial Revolution. As machines replaced certain tasks, new jobs were created which required higher skills and hence edu- cation, leading to universal matriculation and eventually the popularity of higher education. Professionals need to “invent” new jobs for themselves as a means to keep disruption at bay.

Read more: CFA Institute Magazine.