Dark Matter

Benedict Evans explains well the problem with measuring Android tablets. There are no reliable data collected because many of the devices are invisible through the regular, measurable channels:

  • There are no firms which report their shipments
  • They are not sold through retail chains which normally are sampled in the US and Europe (NPD and GfK respectively.)
  • They don’t show up in browsing or ad transaction data
  • Google Play statistics are missing most of the activations since they are not sold as bona fide Google-sanctioned Android.

The only measured statistic happens to be component shipments. Items such as screens, CPUs or perhaps memory might be visible to market analysts. It’s therefore tempting to add up tires manufactured to determine what’s getting sold in auto dealerships.

But it’s also hugely problematic.

Continue reading “Dark Matter”

A way to measure one’s life

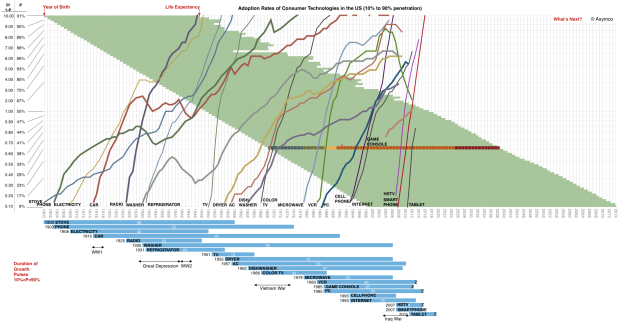
In the post Seeing What’s Next, I showed how the rate of change of adoption of technology varies with time and asked what might be experienced by present and future generations.

It turns out that knowing how what innovations become universal and the speed at which these technologies are replaced can give us an idea of what individuals might experience in their lifetimes.

Here’s how to think about it:

Screen Shot 2013-11-19 at 11-19-8.04.42 PM

Continue reading “A way to measure one’s life”

Seeing What’s Next

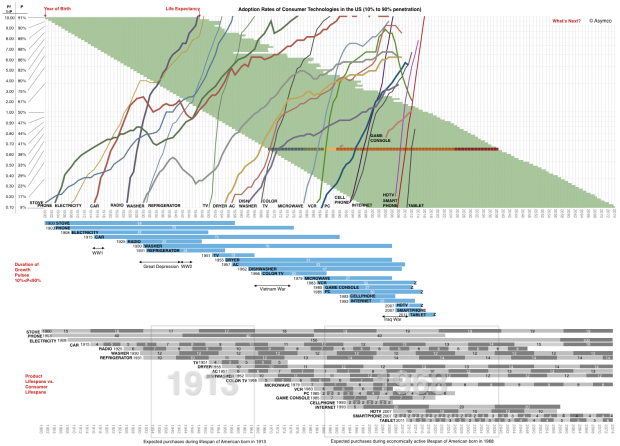
The adoption of smartphones in the US is on track for reaching 90% of the available audience by August 2016. This is a mere eight years after smartphones reached 10% penetration. As far as technologies go, that’s pretty fast. To get an idea of how rapid, I plotted a few other technologies and the time they took to grow within the US market.

Adoption Rates of Consumer Technologies

A few things to note: Continue reading “Seeing What’s Next”

The Critical Path #101: The Genie is Out

The fascination with highly visible but largely unknown business models continues. How do infomercials work? What is the value of fashion? How can you make money when no creative idea can be protected? Why is Apple building a sapphire manufacturing facility? It’s all part of a pattern.

via 5by5 | The Critical Path #101: The Genie is Out.

Asymcar 7: The Transportationist

The Transportationist, David Levinson @trnsprttnst joins us to discuss the technical, human, environmental and economic factors driving change to the auto-ecosystem.David helps us smartly survey the landscape via:

  1. Human behavior
  2. Technology lifecycles
  3. Urban transportion evolution
  4. Network capitalization
  5. Congestion

via Asymcar 7: The Transportationist | Asymcar.

A yardstick for capex

us-navy-ford-carrier.si

Photo credit: Wikipedia, CVN-78

I’ve been writing about Apple’s capital intensive operations for some time. The difficulty has always been in explaining the scale involved. I’ve compared the spending to that of Samsung, Microsoft, Google, Intel and Amazon. But these numbers still can’t be easily grasped. You can’t point to any comparable objects when you try to explain the figure. I struggle to create a less abstract notion than that of a “sea of tooling and servers.”

Instead, I’ve used the analogy of US aircraft carriers. Historically, Nimitz class aircraft carriers have cost a less than $5 billion. The USS Ronald Reagan, christened in 2001, cost $4.5 billion. Therefore I was comfortable saying that Apple spends the equivalent of about one Nimitz class aircraft carrier every six months (and that the Navy takes about six years to put it together.)

Unfortunately, costs for aircraft carriers have gone up. The USS Gerald Ford will take about $13 billion to complete. That places Apple and Samsung capital spending in the following context: Continue reading “A yardstick for capex”

What’s an Active User worth?

Apple has sold 700 million iOS devices. Google claims one billion Android device activations. Microsoft has about 1.5 billion Windows users and Facebook about 1.19 billion. LinkedIn has 259 million users and Twitter has 232 million. Amazon has 215 active account holders and PayPal 137 million.

Markets place a value on these users implicitly when company shares are priced. For example, Twitter whose users are worth about $110 or FaceBook’s $98 and LinkedIn at $93.

This consistency suggests a universally accepted value per social media user but what is the value of an ecosystem user? Apple, Google, Microsoft and even Amazon aspire to enable ecosystems which should be seen are more valuable than mere communities. Ecosystems enable a higher level of economic activity because they are unbounded by the medium itself. Any number of media can be created. Or so the theory goes.

If we could determine a value for an ecosystem user we could test it against the going value of a social media user. Fortunately we have enough data to do so.

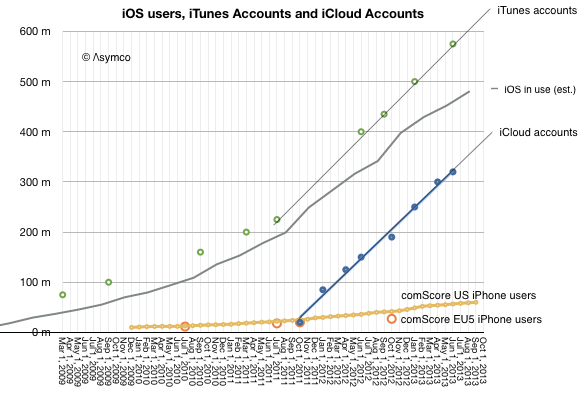
The total number of iOS devices sold per quarter allows us to measure the install base of device users. With some assumptions regarding the retirement and attrition rate we can get the following history:

Screen Shot 2013-11-11 at 11-11-11.52.34 AM

Since the total number of iTunes accounts is updated with some regularity I’ve added it to the graph. I’ve also shown on the same graph the total number of iCloud accounts. For calibration, I included survey data showing the number of iPhone users in two regions (US and EU5). Continue reading “What’s an Active User worth?”

The Critical Path #100: Fin de siècle

The closing of one and the onset of another era. In this hundredth episode of The Critical Path we look back to some of the big questions we asked and ask them again with hindsight and foresight. They are:

  1. What happens to entertainment in the era of pervasive connectivity and computing?
  2. What happens to privacy when citizenship requires divulging all your secrets to commercial entities?
  3. What happens to the structure of computing when diffusions of innovations are instantly global?

via 5by5 | The Critical Path #100: Fin du siècle.

How many years does Apple have?

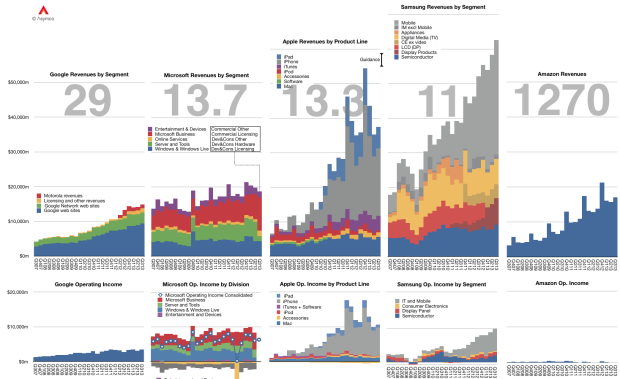
The graph below shows the Revenue and Operating Income for a select group of companies. The large numbers represent the share price to earnings (trailing twelve months) ratio (P/E or PE ratio).

Screen Shot 2013-11-06 at 11-6-2.56.25 PM

Of course the P/E ratio hides a lot of subtlety. It mostly fails to account for the fact that earnings are largely a matter of opinion. A company can defer income (as Apple and Microsoft do), it can invest earnings (as Amazon does) and can otherwise avoid declaring it since it’s taxable. Continue reading “How many years does Apple have?”

The diffusion of iPhones as a learning process

All theoretical and empirical diffusion studies agree that an innovation diffuses along a S-shaped trajectory. Indeed, the S-shaped pattern of diffusion appears to be a basic anthropologic phenomenon.

This observation dates as far back as 1895 when the French sociologist Gabriel Tarde first described the process of social change by an imitative “group-think” mechanism and a S-shaped pattern.1 In 1983 Everett Rogers, developed a more complete four stage model of the innovation decision process consisting of: (1) knowledge, (2) persuasion, (3) decision and implementation, and (4) confirmation.

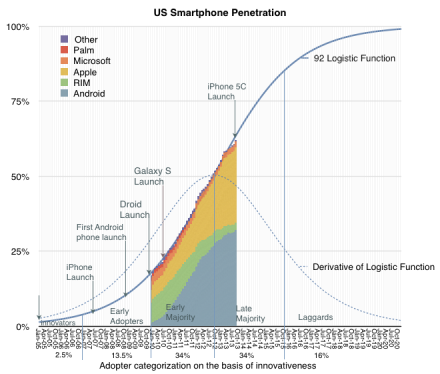
Consequently, Rogers divided the population of potential adopters according to their adoption date and categorized them in terms of their standard deviation from the mean adoption date. He presented extensive empirical evidence to suggest a symmetric bell shaped curve for the distribution of adopters over time. This curve matches in shape the first derivative of the logistic growth and substitution curve as shown below. Screen Shot 2013-11-06 at 11-6-1.51.57 PM

In the graph above I applied the Rogers adopter characterization to the data we have on the adoption of smartphones in the US. The latest data covering September is included.

Continue reading “The diffusion of iPhones as a learning process”

  1. Tarde was probably influenced by mathematician Pierre François Verhulst who first published the logistic function in 1845 []