For more analysis of Apple & the industry, join us at ACTIVE 2025.

The iPhone growth rate

John Gruber puts things in perspective:

The key bit: “At the critical juncture […], when they should have gone for market share, they went for profits.” I think this encapsulates Jobs’s philosophy since taking over Apple in 1997. Take the high end of the market first, establish a brand and presence, then steadily start to expand.

Daring Fireball: N92.

I’ve long argued that Apple is in the phone business to win significant share (i.e. greater than the share they have had in the PC business).  Since the phone market is vast (1.2 billion phones sold in the last four quarters) iPhone volumes must be as well.

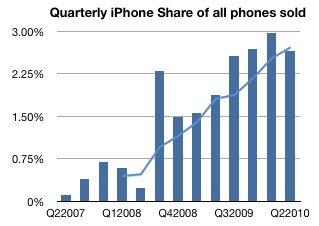
So how has share evolved, and what can we expect? This is a graph of quarterly share for iPhone including a four period moving average:

The trend is clear to see.  With seasonal variation due to the launch cycle, the share is likely to increase over 3% and keep going. How far can it go? That’s a strategic decision for Apple’s management. If we are to take Steve Jobs’ word that their plan is not to be a niche player in any market they target then I have to conclude that Apple is aiming above 10%.

The volume expansion in the US due to the end exclusivity is only the latest in a series of distribution deals that Apple has brought to bear: International expansion, dropping exclusivity in other countries and broadening the portfolio (including earlier models in current line-up) are all natural and obvious moves in a broader market push.

Pricing might be considered another lever that Apple could use, though that seems unnecessary today.

I conclude that growth in iPhone sales of 50% per year seems entirely possible for the next few years. Such growth would allow Apple to reach 10% of the world’s 3G subscribers by 2013. That would still be only 4% of all phones and 20% of smartphones.

Apple growth trading at GE value

Speaking of correlation

General Electric, the largest holding in the S&P 500 Value Index Fund, has a forward price-earnings ratio of fourteen. Apple, the quintessential growth stock and largest member in the S&P 500 Growth Index Fund, sports a P-E based on forward 12-month estimates of just 15.5 right now.

via CNBC’s Fast Money : Growth Vs. Value Confusion as Apple, GE Treated Equally – CNBC.

The near-death experience prerequisite

All phone vendors saw smartphones coming.  They hired all the right market research companies and spent lavishly on analysts to confirm that phones with operating systems were imminent.

Nokia was one of the early movers, establishing its own software platforms group as early as 2002 while others like Samsung licensed Windows Mobile or PalmOS as early as 2003. Yet not much happened to sales. The number of smartphones units sold as percent of total has been fairly low.

The following chart shows the number of smartphones sold as a percent of all phones sold for the top three vendors (as of the time when the chart starts early 2007). Note that the percent of smart products shipped did not accelerate or grow dramatically for the largest two vendors even into last year.  It’s still a pittance at Samsung (<5%) and even less at LG.
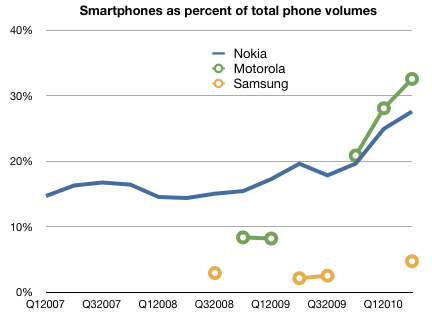
The one vendor that did stage a shift was Motorola. (and Sony Ericsson, though later and softer) Both converts did this shift when faced with near-death experiences of sequential earnings losses and catastrophic market share collapses.

Nokia is showing signs of a secular shift to smartphones but it’s been a decade-long process so far, a slowness that ripped shareholder value to pieces.

So is the precondition for a shift to smartphone focus a collapse in the core business?  It certainly seems so from the data. Motorola first, Sony Ericsson second, Nokia presently and Samsung and LG later.

Each of these decision points reflect precisely the timing of pain points with the core businesses.

Why this asymmetry? At first glance, the smartphone business should be sustaining and an attractive option to be exercised as soon as possible.  It offers better margins, better prices and a better return on capital.

So why is there this disconnect? As regular readers of this blog can probably guess, my hypothesis is that the smartphone business is disruptive.  Incumbents are motivated to ignore this business because it makes money in ways they cannot control. More importantly, their best customers are signaling (in non-transparent ways) that they don’t want their top vendors to participate in this market.

Is an iPhone worth 8 Nokia phones or 2 Blackberries?

Pricing is a leading indicator of value. Some might argue price and value are often out of whack but, in the long term the two converge.

So it’s instructive to measure how a vendor creates value by what it’s able to charge for its goods. In the case of mobile phones, price is summarized by something called ASP (average selling price) which is measured each quarter across a vendor’s entire portfolio.

Again, there might be local fluctuations, but the trend is your friend here.

Take a look at these charts I prepared based on the group of seven vendors I previously analyzed in terms of their sales and volume performance.

First, a history of pricing since Q2 2007. All figures are in US dollars current as of time of reporting.

Continue reading “Is an iPhone worth 8 Nokia phones or 2 Blackberries?”

In phone sales, RIM plus Apple equals Nokia

Following up from the last article on the global phone units sold over the last three years (Visualizing the winners and losers of three years of smartphone share growth), we take a look at the sales in dollar terms over the same period.

Remember that in the article on units, the pure-play smartphone entrants HTC, RIM and Apple grew from a combined unit share of 1.3% in Q2 2007 to a combined unit share of 7.7% in Q2 2010.  That’s a 6 fold increase in volume share. Quite remarkable for companies lacking the vast resources and industry connections of the incumbents.

However, when we look at their performance in value (dollar sales) vs. units sold, the performance of the entrants begins to look miraculous.

Continue reading “In phone sales, RIM plus Apple equals Nokia”

US as epicenter for mobile data utilization

Japan and Korea have further 3G reach but use it significantly less.

His findings support notions that Android and iPhone are controlling data use in the US. The iPhone’s current exclusive home, AT&T, and Android-favorite Verizon both make up 75 percent of American data use

via Smartphone data use up 50% in just six months | Electronista.

Is there any surprise that in the country where the iPhone and Android are most popular there is the highest data usage even though it has one of the poorest mobile data infrastructures in the developed world?

What does that say about the importance of the device (and not the network) to the adoption of data services.

There are implications about the relative power shift between operators and device vendors. Within the mobile value chain, as mobile data overtakes mobile voice, the economics and value propositions will shift. The motivation of participants will begin to diverge and a schism will occur.

Visualizing the winners and losers of three years of smartphone share growth

Many consider June 2007 to have been a pivotal moment in the history of mobile phones. Apple’s entry with the iPhone has re-defined the market in many ways. However, there was a smartphone market before then. About 28 million smartphones shipped the quarter when Apple launched out of an overall phone market of 265 million. Apple’s entry with 270k phones was a drop in the bucket.

I thought it would be instructive to chart what happened between that quarter, exactly three years ago and today. I collected the data from IDC, Gartner and Canalys and company reports to paint a few pictures.

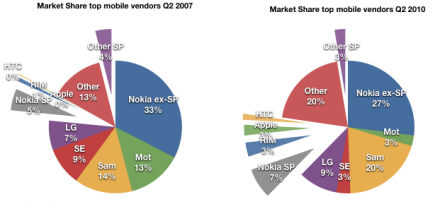
First, the market shares (by units) of the top mobile vendors, Q207 vs. Q210. I highlighted the smartphone vendors by separating their wedges from the pie. Note that I also separated Nokia’s smartphones from Nokia’s regular phones as two separated wedges–Nokia ex-SP for no smartphones and Nokia SP as their “converged” units. I did the same with “other”.

Continue reading “Visualizing the winners and losers of three years of smartphone share growth”

The parable of the transistor

This weblog could be read as a diary of the disruption of the mobile industry. There is lots of topical analysis and opinion, but sometimes I’ll post on the “theory” which describes what’s going on in a more abstract, and long-term, level. Theory is like a bullion cube: savory, but too concentrated to be enjoyed undiluted. For this reason, the most palatable way of administering theory is through example. So we kick off with an example of what happened to another technology industry as a result of the emergence of a disruptive technology.

The following is a draft article I wrote describing the “electronics industry” for POSTWAR AMERICA: AN ENCYCLOPEDIA OF SOCIAL, POLITICAL, CULTURAL, AND  ECONOMIC HISTORY. It is itself based on a presentation by Clayton Christensen at the Open Source Business Conference in 2004.

—-

The consumer electronics (CE) industry began in 1920 when radio broadcasting commenced in the United States. Radio technology sustained a growing electronics business throughout the 1930’s and 1940’s, however, the electronics industry underwent a major transformation after the war. The critical development came after 1948 when the transistor was first invented. The transistor and the subsequent development of solid-state semiconductors dramatically and profoundly changed the industry. The change the transistor brought was not just evident in measures of technical performance but also in the economics of the industry and the business models required of its participants

Continue reading “The parable of the transistor”

Warner Music slows while iTunes grows

Revenue from digital sales of recorded music grew just 3.7 percent to $169 million. That’s a slower pace than the 4.5 percent growth posted a year ago and 39 percent growth two years earlier.

via Warner Music CEO looks `beyond iTunes’ amid losses – Yahoo! Finance.

For the record, iTunes did grow at 35% in the quarter that Warner Music grew digital sales by 39% two years ago.

But the two diverged a year ago with 17% iTunes vs. WMG’s 4.5% and this past quarter iTunes grew at 27% vs. 3.7%.

Gives us an idea of how much Apps have swelled iTunes’ top line.