For more analysis of Apple & the industry, join us at ACTIVE 2025.

Apple added $38 billion in cash last year

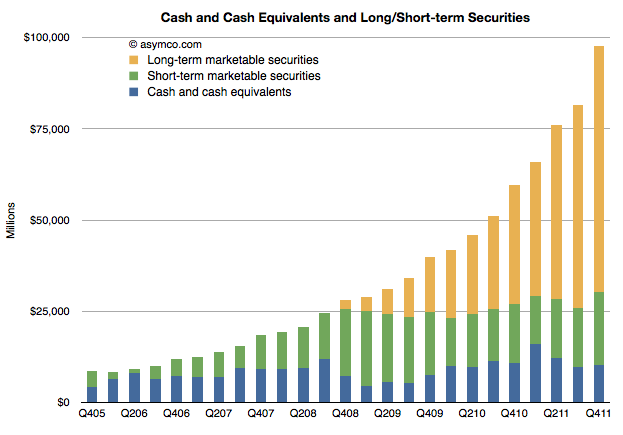
Last year I suggested that Apple could reach $100 billion for 2011. That was based on the addition of about $20 billion during 2010. Apple added $38 billion to reach $97.6 billion at the end of 2011.

The following chart shows the composition and scale of Apple’s cash holdings.

At the closing price, Apple’s market value is equivalent to 4.3 times the value of their cash.

The story of Fernforest and Petro Dale

Once upon a time there were some innovative farmers that developed a new hybrid crop that could satisfy the hunger of a growing population. This crop grew best in large farms which had to be situated far from where people lived. The food was so tasty and production could scale so quickly that it became necessary and possible to build a novel way to deliver this food to the population. The farmers built their own transportation network, which they called a “railway”.

This network of rail was itself very efficient and soon overtook the ability of restaurants and small shops to absorb the produce. In order to keep the pipeline of food filled, the farmers (now with their own railways) bought most restaurants and grocery stores. They transformed them into more efficient food retailers and the result was even more consumption and demand for the food.

To keep the population happy, the farmers constantly devised new food hybrids and new recipes for the restaurants. The food design process became a profession, even an art form. The farmers employed the best and most creative minds  when it came to food. They created unique recipes that became instant hits and were widely consumed. They invented “star foods” and “blockbuster dishes”. The process of churning out these hits was so highly honed that farms became factories of ideas.

Continue reading “The story of Fernforest and Petro Dale”

Introducing Asymconf

Asymconf is the Asymco experience. Live.

Attendees will be treated to an engaging, participatory experience. Using the case method, you will be guided through four probing questions pertinent in modern market analysis.

  1. What is disruption and how can it be harnessed? The case of mobile computing.
  2. What are the jobs that the entertainment industry is hired to do? The case of Hollywood.
  3. Is Wall Street more than good enough? The case of financial over-service.
  4. What are the limits of education? The case of learning and the theater.

If you would like to take part, please register your interest here.

—Horace Dediu & Indrek Vainu


The conditions for survival and prosperity

Yesterday’s post described the history of personal computing platforms over the past 37 years. It showed a distinct shifting of “eras” between traditional personal computing and the emergent mobile computing represented by device-based platforms.

Underlying these lives (and deaths) of platforms were the growth (and decline) of fortunes of companies and people. I hoped that by observing these patterns insight could be gained into the conditions for success or failure.

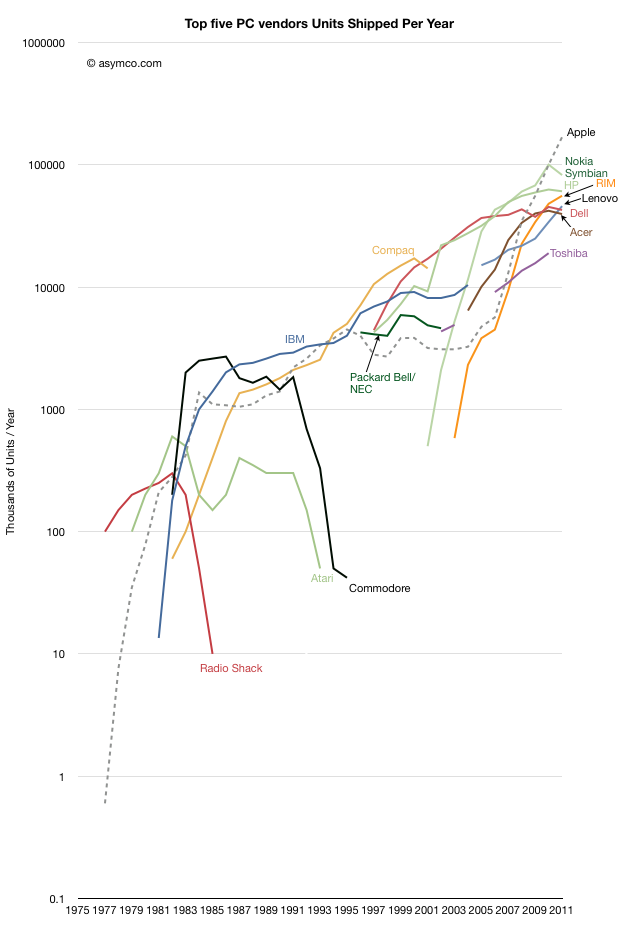
The following graph shows the companies which were predominant (in the top five ranking by shipments[1]) during each year of the industry’s history and the volumes they were able to obtain during that period. I also added Nokia and RIM as examples of the challengers coming from mobile devices.

It’s a difficult graph to interpret. Continue reading “The conditions for survival and prosperity”

[Updated] The rise and fall of personal computing

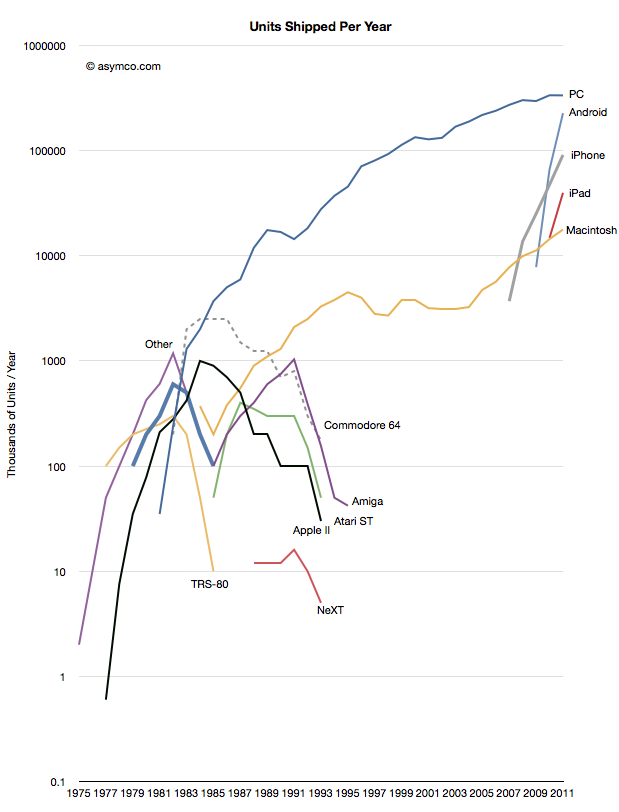
Thanks to Jeremy Reimer I was able to create the following view into the history of computer platforms.

I  added data from the smartphone industry, Apple and updated the PC industry figures with those from Gartner. Note the log scale.

The same information is available as an animation in the following video (Music by Nora Tagle):

httpv://www.youtube.com/watch?v=8h-C6u4yLj4

Continue reading “[Updated] The rise and fall of personal computing”

Apple as top personal computer vendor

“Yes. I think it’s possible if you integrate tablets”

– Meg Whitman, HP CEO in response to the question of whether Apple could overtake HP in computer sales in 2012.

via HP CEO Meg Whitman Admits Apple Could Surpass HP in 2012 | MacTrast.

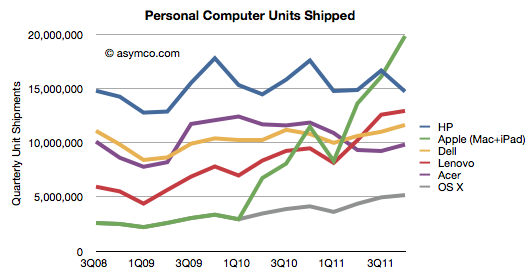
However, according to Gartner, HP shipped 14.7 million PCs in the last quarter. While we don’t have the total global figure for Apple, my estimates are 5.2 million Macs and 14.7 million iPads, for a total of 19.9 million computers in the same period.

There might be an error in both Gartner’s and my numbers, but the gap of over five million in Apple’s favor is unlikely to disappear.

The history of shipments from these vendors  is shown below.
The market shares are also shown here:
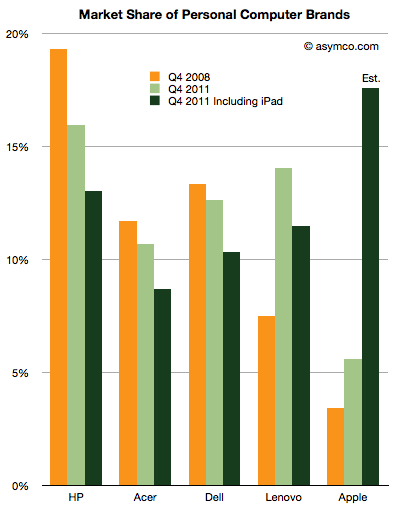
I included the market shares thee years ago, and the rankings with the iPad excluded.[1] Apple went from 3.42% share at the end of 2008 to 5.6% share today excluding the iPad or 17.6% including the iPad. HP went from 19.3% in 2008 to 16% today or 13% if iPad is included.

Apple is ahead of schedule on their taking[2] the top spot in terms of units.

Notes:

  1. Although vendors other than Apple also sell tablets, their totals are unpublished and I am not aware of any estimates so. If anyone has seen estimates I would be happy to amend the data.
  2. Throughout the history of the industry, Apple never held the top spot.   The Apple II peaked at 15.8% in 1984 and the Mac at 12% in 1992.

Is the iPad a PC?

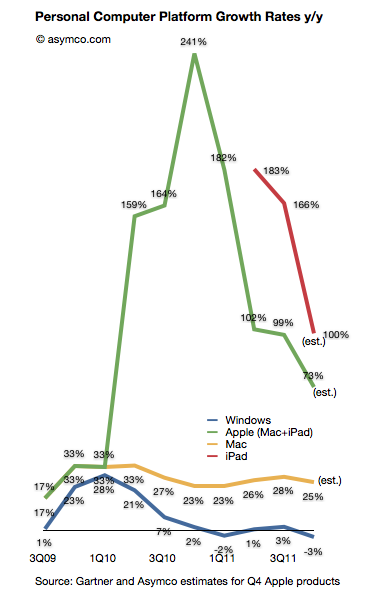
Gartner published its estimates for “PC” shipments during the fourth quarter. As I’ve done in the past, I combined their estimates with known shipments from Apple and separated Apple’s performance from the Windows-based market.

I also take into consideration the iPad as a potential competitor for computing purchases. Apple will report fourth quarter results including Mac and iPad shipments in less than two weeks but I am using my own estimates until then.

Here is how the platforms grew over the last few quarters (all figures are global):

The Gartner data implies Continue reading “Is the iPad a PC?”

5by5 | The Critical Path #21: Negative Costs

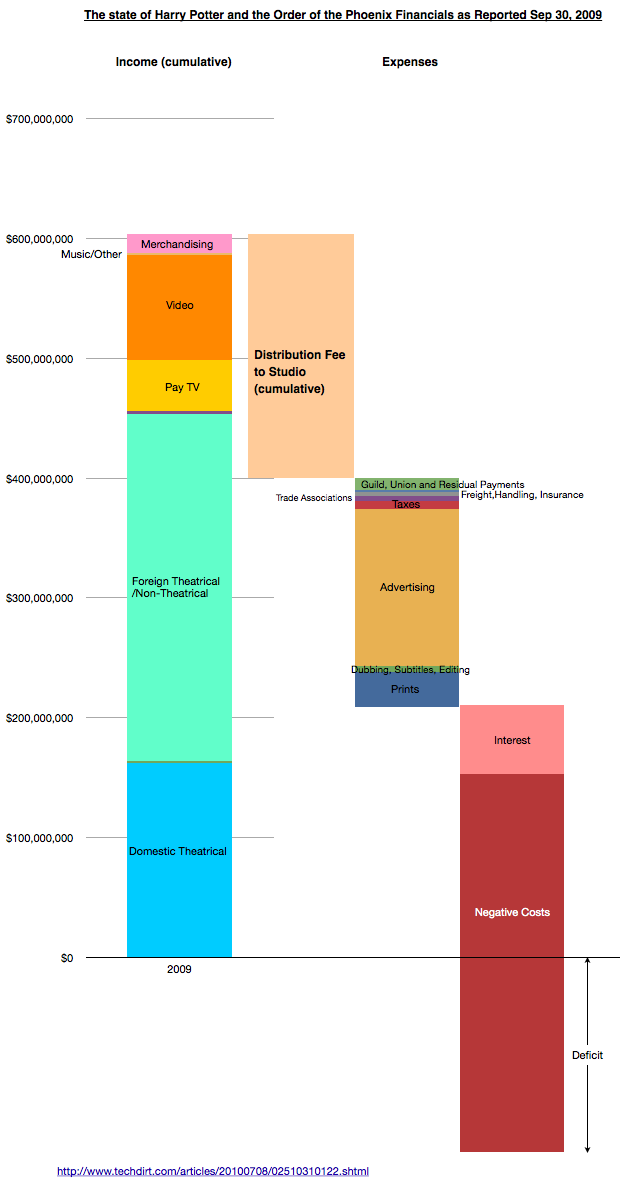
Continuing their discussion of the creative side of Hollywood accounting, Dan and Horace take a look at the way income from movies is distributed and why no movies ever make money. The observations sharpen focus on the over-arching influence distribution has on the creative process.

5by5 | The Critical Path #21: Negative Costs.

 The following chart is a visualization designed to accompany the podcast:

Compensation based on “Net income” depends on there being a surplus rather than deficit. The problem is that the Fees and claims on income increase as they are defined as a percent of total income so the goal of break-even is a moving target.

The Negative Costs are approximated by the production costs as discussed and visualized in the previous podcast here.