Combating superlatives fatigue

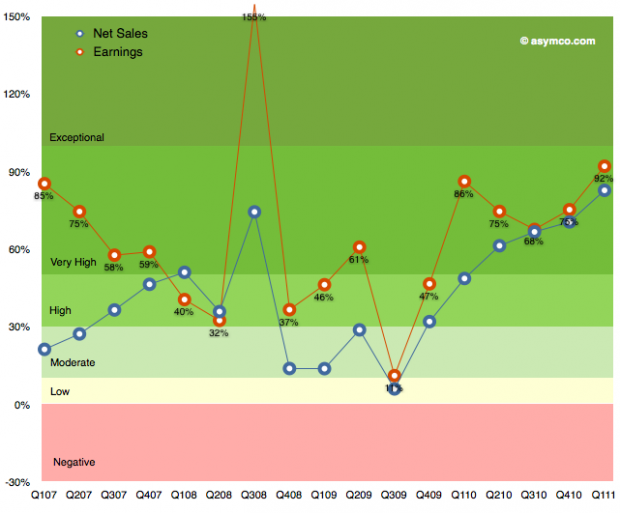
The following chart shows Apple’s growth for net sales and earnings over the last few years. I’ve used a grading system with color coding to show bands of growth.

It’s easy to become de-sensitized to the scope of these numbers, but it bears repeating: the growth has been steadily increasing since 2009.

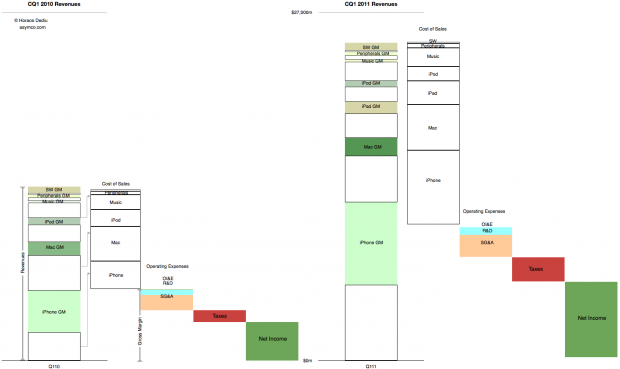
These abstractions in growth can also be shown in a direct “before-and-after” view of the income statement.

This latter view gives an idea of how much bigger the company’s business is now vs. a year ago. Not just on the revenues but also the cost of these revenues and what is retained.

This story never gets old.

Windows generates less than a third the profit of iOS + OS X

While a lot of the credit for Apple’s success is rightfully assigned to the iOS franchises, the OS X business has more than quadrupled in five years. This has happened without drastic price fluctuations. Neither holds for the overall PC industry which has seen both volume and sales decline while prices have eroded along with profitability. On top of that, growth has nearly evaporated.

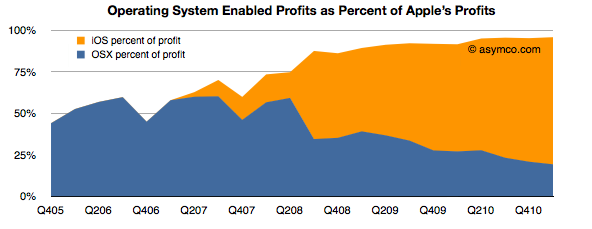
Even with this success, as a percent of total value created, the Mac accounts for a mere 13% of Apple’s profit. Including software as part of the OS X franchise implies that OS X is enabling about 20% of Apple’s profits.

iOS, on the other hand, is accounting for more than 75%. These two platforms combined amount to 96% of Apple’s profits (up from 50% four years ago).

Continue reading “Windows generates less than a third the profit of iOS + OS X”

The market values Apple's balance sheet, not its income statement

As I have tediously repeated in this blog, Apple’s share price has been de-coupled from its earnings for many years. Consistent earnings growth above 70% is not seen as valuable. As the chart below shows, there is no correlation between EPS growth and value growth.
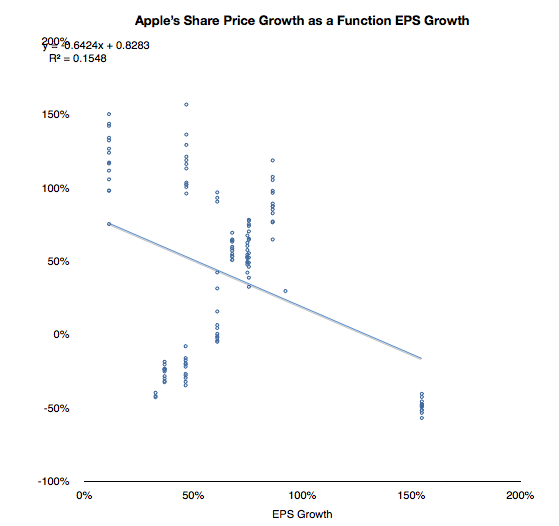
With the outlying quarter when 154% growth was matched by a negative 50% price change, the correlation does not look much better:
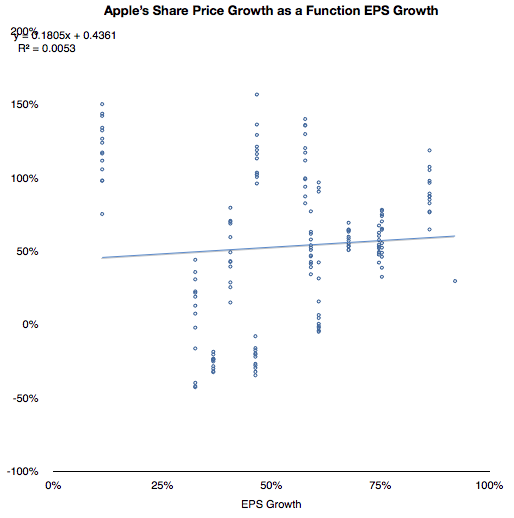
If we cannot correlate share price with growth then what is being valued? This has been a vexing problem because growth is the traditional, and logical, metric of valuation. Share prices, by definition (net present value of future cash flows) reflect future potential. That potential is more sensitive to growth than to anything else.

But I’ve been leaving one factor out of the share price definition. Share price is NPV of future cash flows plus current assets.

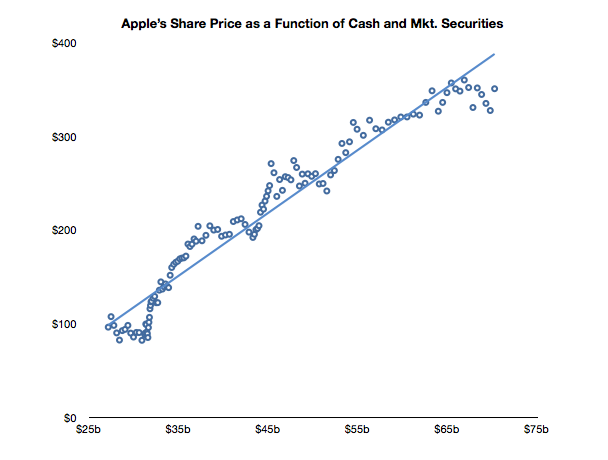
Since future cash flows are being thrown out of the equation, the company must be valued as a multiple of its cash. Does this relationship hold true?

In the chart below I show the weekly closing price of the shares and the corresponding value of the interpolated cash (and marketable securities) per share over the last two and a half years.
Continue reading “The market values Apple's balance sheet, not its income statement”

When exceptional growth is not an exception

Apple’s last quarter’s sales growth was an impressive 83%. It was not as high as the 92% earnings rise because there was a higher mix of iPhones this quarter than in the past. The iPhone is the most profitable product in Apple’s portfolio so it impacts the gross margin significantly.

The iPhone is, in fact, a huge part of Apple’s business. In units it reached 5% global share and 14% US share. I’ll go over the overall industry data as soon as all the major reports are in, but already it has been estimated that Apple is the largest phone vendor by profit and sales.

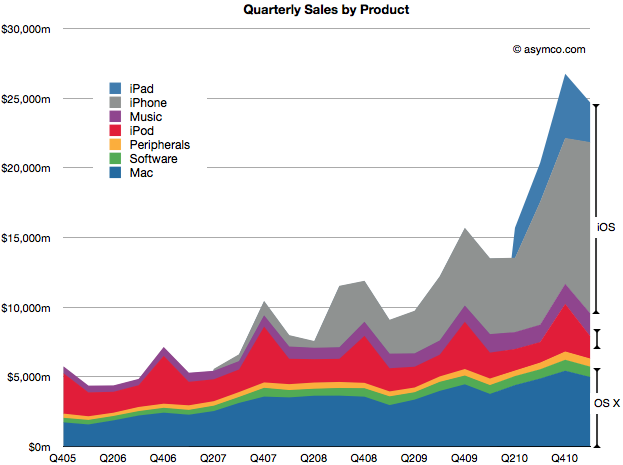
In the following chart, you can see just how important the iPhone has become. Together with the iPad and iPod touch, iOS-powered devices make up about 65% of sales. That’s almost three times the value of OS X based products which make up 23% of sales. That also leaves just 12% of sales not directly affected by these two juggernaut platforms (though music and peripherals are clearly indirectly affected by Apple’s own platform products.)

The following chart shows the same information as shares of total net sales. Continue reading “When exceptional growth is not an exception”

The Apple Growth Scorecard

Apple’s revenue for the first quarter was $24.7 billion, which at 83% was the largest quarterly revenue growth they ever experienced. Operating margin was an all-time high of almost $7.9 billion, representing 31.9% of revenue and yielding 95% EPS growth.

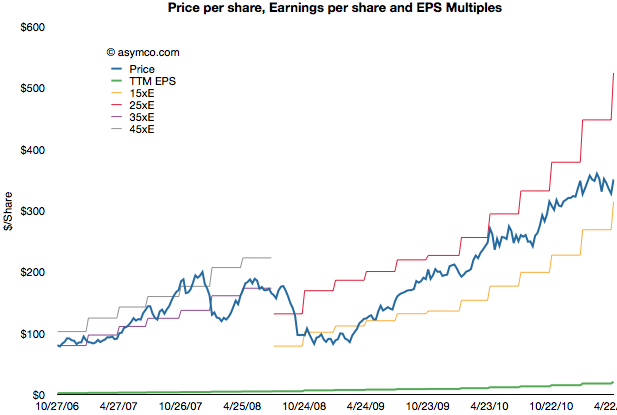
After earnings were announced the share price reached $350.7. This includes $70 in cash. Trailing twelve months’ earnings were $20.97. That makes the Price/Earnings ratio 16.7. Excluding cash, P/E is 13.4. The average growth over the past four quarters was 77%.

The following chart shows the share price vs. earnings. The green line is price and the blue line is share price. I also added multiples of the earnings to show how the stock traded in certain multiple bands.

During the period of 2006 to 2008 the company shares traded Continue reading “The Apple Growth Scorecard”

If Cash is King, Apple's is an Emperor [Updated]

Apple’s cash for short-term and long-term marketable securities totaled $65.8 billion at the end of the March quarter. Cash increased by $6.1 billion.

The increase in cash is net of approximately $900 million for prepayments and capital expenditures related to the strategic supply agreements that Apple announced last quarter.

The following chart shows the historic cash, short-term and long-term liquid assets Apple holds.

As in previous quarters, the securities Apple holds are: Continue reading “If Cash is King, Apple's is an Emperor [Updated]”

The iPad slowdown and impact from the Japanese disaster

Tim Cook explains that there was no material impact from the Japanese disaster:

“Regarding our global supply chain, as a result of outstanding teamwork and unprecedented resilience of our partners, we did not have any supply or cost impact in our fiscal Q2 as a result of the tragedy, Continue reading “The iPad slowdown and impact from the Japanese disaster”

Estimates for Apple's third fiscal quarter (ending June)

Apple’s CFO guidance statement:

We expect revenue to be about $23 billion compared to $15.7 billion in the June quarter last year. We expect gross margin to be about 38%, reflecting approximately $55 million related to stock-based compensation expense. We expect OpEx to be about $2.5 billion, including about $255 million related to stock-based compensation expense. We expect OI&E to be about $70 million and we expect the tax rate to be about 25%. We are targeting EPS of about $5.03.

Apple Management Discusses Q2 2011 Results – Earnings Call Transcript – Seeking Alpha

Last quarter Apple guided revenue growth at an aggressive 63% with an EPS growth of 47%. They delivered 83% and 93% respectively.

They are now guiding about 47% revenue growth and 43% EPS growth and my current estimates are 65% and 72% respectively based on the following:

  • iPhone units: 14.7 million (75%)
  • Macs: 4.3 million (25%)
  • iPads: 9.8 million (200%)
  • iPods: 8.0 million (-15%)
  • Music (incl. app) rev. growth: 25%
  • Peripherals rev. growth: 25%
  • Software rev. growth: 25%
  • Total sales: $25.8 billion (65%)
  • GM: 38.5%
  • EPS: $6.02 (72%)

The biggest uncertainty remains iPad growth. This will be the first quarter where we can dial in a y/y growth rate. I’m being bullish with 200% because I believe the ramp for the iPad 2 may get sorted out. There are also more countries being opened up this quarter (13 this week).

Apple’s stock price to earnings ratio has dropped to 16.72. Ex-cash it’s 13.5. On a forward basis (my estimates) it’s 8.3. Apple’s valuation is now a case for business historians to discuss because I don’t think there are modern precedents.


A new era is only a new state of mind

The following interview was conducted by Bruno Ferrari a writer about technology for EPOCA, the weekly magazine of Organizações GLOBO, the largest Brazilian media company on March 30 2011. The article (published in Portuguese here) is an edited subset of the following exchange.

Q: In your analyses, you mention tablets as part of a new era, the “Post PC era”. Why do you think the PCs will be replaced by tablets?

This is not quite correct. Post PC does not mean the end of the microcomputer. The way to think about it is this: The stone age did not end because we stopped using stones. Same with the iron age and the industrial era. The era of jet travel did not end automobile or even ship travel (though that changed to recreation rather than transportation for passengers.) Each phase of technology does not fully replace its predecessor. It offers a new set of solutions and perhaps a slightly different way of solving old problems. We’ll still have PCs but we will use a new type of computer, an even more personal computer. The world still uses the microcomputer’s technological ancestors.

In terms of what new jobs will we hire the tablets to solve, they will vary greatly from what we used PCs for. Just like we used microcomputers for different things than we used time-shared minicomputers and mainframe computers. I expect social interaction, media consumption and entertainment will move from a PC to a tablet. New uses will emerge from the vast experiment that is the app phenomenon.

Q: What are the new ways to interact with machines? With gestures? How will this change the market? Continue reading “A new era is only a new state of mind”