In yesterday’s post, I proposed a way to inspect the Google-Apple distribution deal. It could be understood as a flat-rate deal where default placement of Google search in Safari is paid for with a constant run rate. This was the assumption for a few years with estimates for this run rate ranging widely.
Alternatively, it could be understood as a commission rate where payments are in proportion to ad sales. This is the 36% commission rate that has leaked during the antitrust trial.
Finally, it could also be seen as an access fee for each individual. This is the 17c/user/day that seems apparent from my calculations.
If one were to critique these options, I would disqualify the flat rate as unfavorable to Apple since the user base grows and behaviors can shift. The distribution commission sounds ideal but it would be problematic to enforce. How exactly can one track the precise income obtained by Google for each use of search, maps or YouTube on iOS or MacOS devices reliably enough with an audit trail for Apple to inspect?
For these reasons, I believe the fee of $x/user (or possibly active device as a proxy) makes more sense. The burden would be on Apple to prove that they have such active users/devices while Google could sample their metrics to confirm. Data on active users and devices are figures that Apple already supplies publicly and a method for determining them likely could stand scrutiny by outsiders. The server logs showing active devices can’t be too onerous to share.
And so that’s the model I’m going with. Having said that, the formulation of compensation for what is a complex distribution deal is likely complex. The abstraction to users/devices is one we have to live with given the challenges of inspecting the invisible.
That’s the model of the present. The future however is clouded by the potential interference of authorities. In this case, an antitrust prosecution of Google is asking whether the way Google buys distribution is anti-competitive. The legal arguments are beyond scope here but the gist of it is that buying exclusive distribution when you are dominant may close options to not-so-dominant competitors.
The consequences, if we are to believe the commentary, are that the deal with Apple could be declared illegal and thus, stay with me here, Apple would lose a lucrative source of income.
Let me repeat this for emphasis: If Google were found guilty of anti-competitive behavior, Apple would be punished.
Let me expand for emphasis: If Google were found guilty of anti-competitive behavior, Google will be forced spend far less and be marched off a gangplank to swim in far greater profits.
Given this commentary one wonders why Google’s management and legal team aren’t begging the judge to rule against them and why Google shareholders aren’t hoisting the prosecuting team on their shoulders.
The deal between Google and Apple exists only because both Google and Apple find it to be a better alternative to not having a deal or having any another deal. It does not exist because Apple benefits and Google doesn’t or that Google benefits and Apple doesn’t.
As I’ve explained the first post in this series, Google’s benefit is distribution or access to 1.3 billion very valuable customers. For this they pay quite a lot and Apple receives quite a lot in turn. The relationship is shown in this illustration:
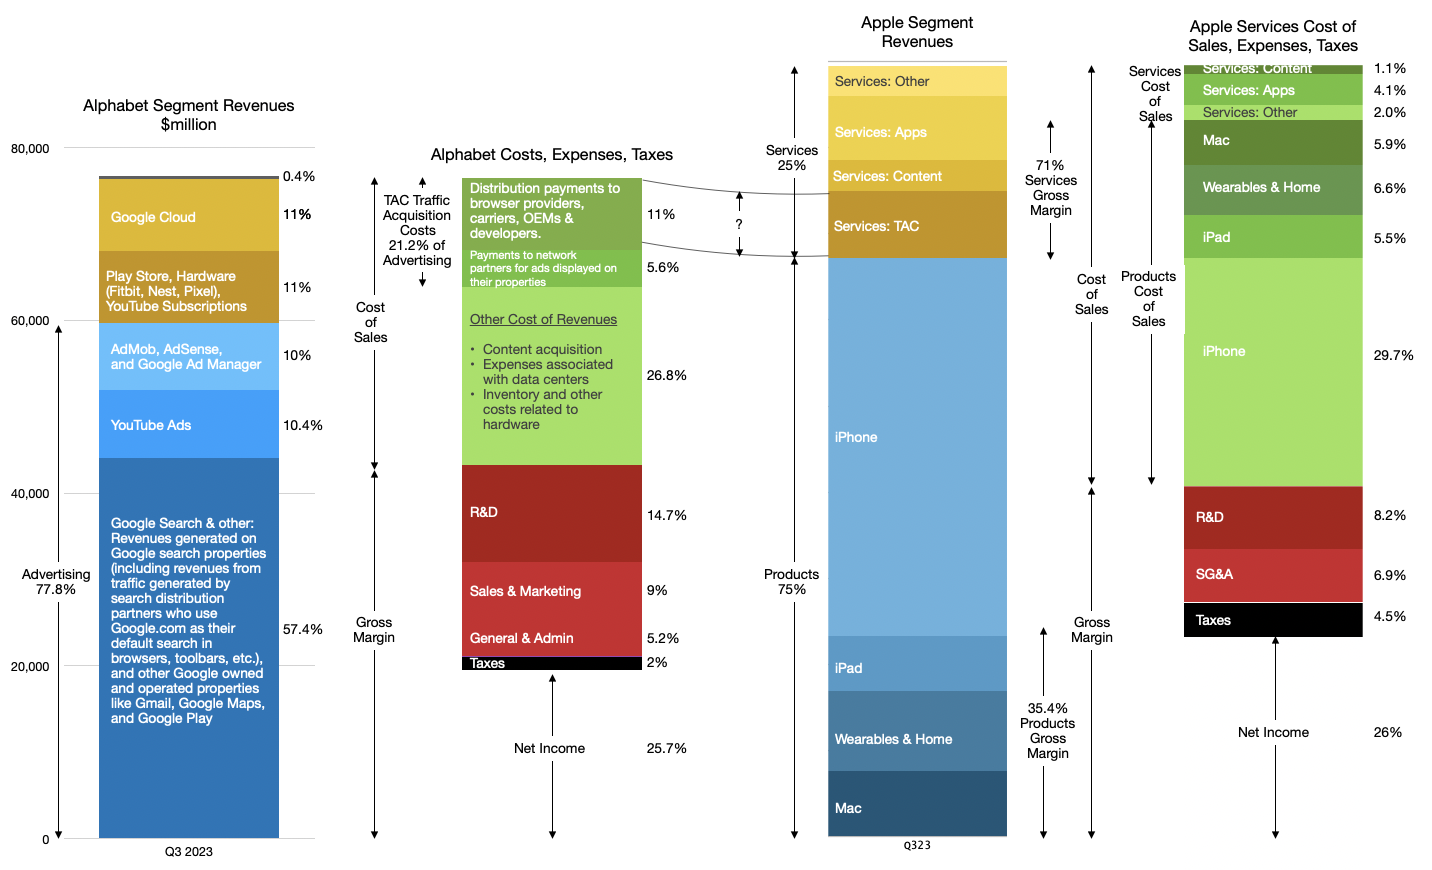
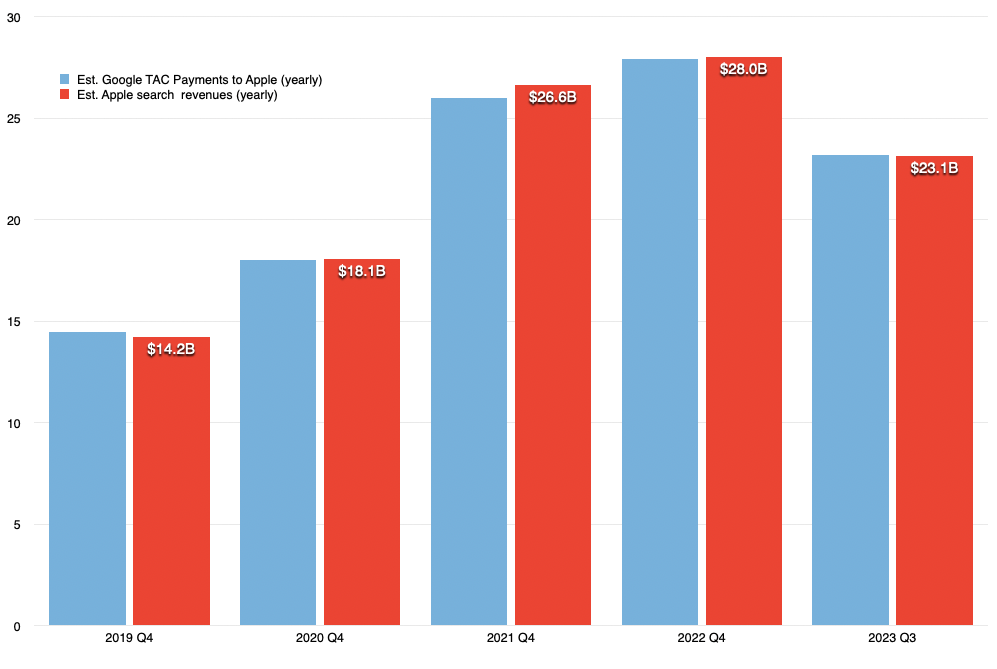
But—and here you should pay close attention—Apple also pays something for that benefit. Apple’s $26b+ income from Google’s TAC payments are in exchange for offering access. To Google. Not to someone else. And not to itself. Apple’s costs are opportunity costs.
If Google had not offered the area marked with a question mark in the image above then Apple would have found alternatives. Alternatives that it’s saying no to today.
Apple’s alternative to the deal is what needs to be studied.
Could, for example, Apple have signed Microsoft for Bing access in Safari? Sure! They probably didn’t because, as they declared, the quality of Bing would not be as good and as a result most people would switch out of it and thus result in lower revenues. Then again, perhaps Apple could make a fortune from Microsoft. Apple could have enabled Microsoft to rise to 40% market share in search, and also improving its quality. How much would that be worth to Microsoft? How much additional opportunity could Microsoft create from establishing such a strong consumer-facing franchise—something they have struggled to obtain even with vast expenditures. Surely Microsoft could be convinced to split revenues 50/50 for what would be all marginally zero-cost new upside!
Could Apple have developed its own search? Sure! They probably already did. Internet Search is a lot easier in 2023 than it was in 2007. Costs for computation, communication and storage drop exponentially while the number of internet hosts has stopped growing. Apple uses indexing in Siri and each iPhone, Mac and iPad runs a local search engine (Spotlight). Again, there are reasons why this is not as good or easy as signing Google up. But on the other hand, perhaps Apple could be making a killing on search. Why accept a 36% commission from Google when they could take 100% of 40% of all Search?
But most importantly, a declaration that this deal is invalid simply means that Apple and Google would craft another deal that would work around the restrictions. And that new deal would probably turn out to be more beneficial to Apple.
Why, I hear you ask?
Because Google would ask for the changes! Google would be forced to re-negotiate because they lost at trial. If that were the case, Apple would naturally ask for concessions. The most certain outcome would be that Apple will be paid even more for access to its users.
How much more? Remember that Google must ensure access to Apple’s customers. According to my calculations Apple customers deliver almost 40% of its advertising revenues. The 36% commission suggests that there is plenty of head-room. Apple could ask for 50% and meter the results on a different basis. This would be a 39% increase in pricing for distribution.
This would result in a deal worth $41 billion/yr.
To implement workarounds, the companies would need to bridge their servers in order to ensure metering along new metrics. There would a great deal of complexity. But it would be worth it because both would find such a deal better than alternatives.
Fundamentally, the relationship between Google and Apple exists and will continue to exist because it is mutually beneficial and a better alternative to any other agreement or no agreement. If the current deal is found unsound, for whatever reason, a new deal will be created because it will need to be created.
Apple sits in a better position today than it ever did. Its customer base is growing while its pricing power with consumers is growing. In contrast, Google is the process of explaining that it did not break any laws. This while losing Android users to Apple. How does this lead to a vulnerability for Apple?
What we are witness to here is Apple increasing its distribution pricing power while simultaneously decreasing its opportunity costs.
The idea that Google being found guilty of anti-competitive behavior would result in a “hit to Apple earnings” is preposterous and fails on first inspection. The exact opposite is the likely outcome.